Exam 2: Graphical and Tabular Descriptive Techniques
Exam 1: What Is Statistics39 Questions
Exam 2: Graphical and Tabular Descriptive Techniques192 Questions
Exam 3: Numerical Descriptive Techniques215 Questions
Exam 4: Data Collection and Sampling82 Questions
Exam 5: Probability200 Questions
Exam 6: Random Variables and Discrete Probability Distributions158 Questions
Exam 7: Continuous Probability Distributions149 Questions
Exam 8: Sampling Distributions127 Questions
Exam 9: Introduction to Estimation85 Questions
Exam 10: Introduction to Hypothesis Testing178 Questions
Exam 11: Inference About a Population75 Questions
Exam 12: Inference About Comparing Two Populations, Part 183 Questions
Exam 13: Inference About Comparing Two Populations, Part 284 Questions
Exam 14: Analysis of Variance125 Questions
Exam 15: Chi-Squared Tests118 Questions
Exam 16: Simple Linear Regression and Correlation231 Questions
Exam 17: Multiple Regression143 Questions
Exam 18: Review of Statistical Inference182 Questions
Select questions type
The two most important characteristics revealed by the scatter diagram are the strength and direction of the linear relationship.
(True/False)
4.9/5  (46)
(46)
A line chart that is flat shows no fluctuation in the variable being presented.
(True/False)
4.9/5 (27)
A category in a pie chart that contains 50% of the observations is represented by a slice of the pie that is equal to ____________________ degrees.
(Short Answer)
4.9/5 (44)
A pie chart shows the ____________________ of individuals that fall into each category.
(Short Answer)
4.9/5 (37)
Forty truck buyers were asked to indicate the car dealer they believed offered the best overall service. The four choices were A, B, C, and D as shown below:
 Construct a table showing the frequencies and relative frequencies for this data set. What proportion of car buyers rated dealer D as the best?
(Essay)
4.8/5 (34)
When two variables are linearly related, and tend to move in opposite directions, we describe the nature of their association as a negative linear relationship.
(True/False)
4.9/5 (42)
Your age group (1-9; 10-19; 20-29; 30-39; etc.) is an interval variable.
(True/False)
4.8/5 (28)
In order to draw a scatter diagram, we need interval data for
(Multiple Choice)
4.8/5 (33)
If two variables have a strong linear relationship, that means one variable is causing the other variable to go up or down.
(True/False)
4.7/5 (36)
Compare the spread of the two histograms below. Which of the following is true? 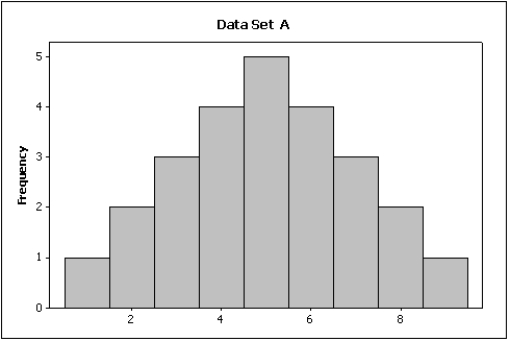
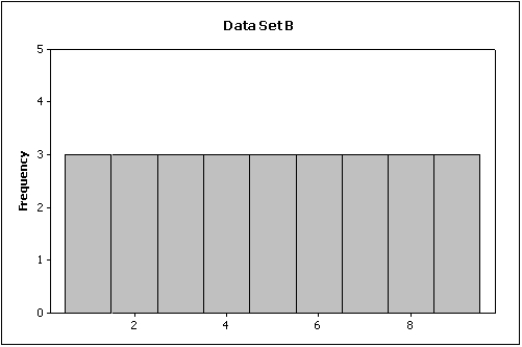
(Multiple Choice)
4.8/5 (35)
One of the variables used to help predict unemployment rates is the rate of inflation. Accordingly, we identify rate of inflation as the ____________________ variable, and unemployment rate as the ____________________ variable.
(Short Answer)
4.8/5 (35)
In purchasing a used computer, there are a number of variables to consider. The age of the computer is an example of a(n) ____________________ variable.
(Short Answer)
4.9/5 (37)
The final grade received in a Literature course (A, B, C, D, or F) is an example of a(n) ____________________ variable.
(Short Answer)
4.8/5 (27)
A histogram is said to be ____________________ if, when we draw a vertical line down the center of the histogram, the two sides are identical in shape and size.
(Short Answer)
4.8/5 (38)
The line chart below shows potato prices per pound for each month from January (month 1) to December last year. By looking at this chart you can see the lowest potato prices occurred in ____________________. 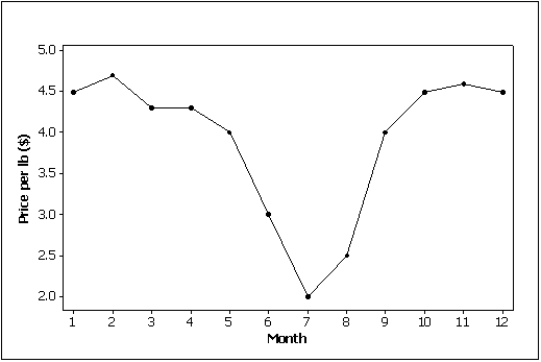
(Short Answer)
4.9/5 (40)
Insurance Company: A representative from a local insurance agency selected a random sample of insured homeowners and recorded the number of claims made in the last three years, with the following results:
 -How many homeowners are represented in the sample?
(Essay)
4.9/5 (24)
Filters
- Essay(0)
- Multiple Choice(0)
- Short Answer(0)
- True False(0)
- Matching(0)