Exam 16: Additional Topics in Time Series Regression
Exam 1: Economic Questions and Data17 Questions
Exam 2: Review of Probability71 Questions
Exam 3: Review of Statistics63 Questions
Exam 4: Linear Regression With One Regressor65 Questions
Exam 5: Regression With a Single Regressor: Hypothesis Tests and Confidence Intervals59 Questions
Exam 6: Linear Regression With Multiple Regressors65 Questions
Exam 7: Hypothesis Tests and Confidence Intervals in Multiple Regression65 Questions
Exam 8: Nonlinear Regression Functions62 Questions
Exam 9: Assessing Studies Based on Multiple Regression65 Questions
Exam 10: Regression With Panel Data50 Questions
Exam 11: Regression With a Binary Dependent Variable50 Questions
Exam 12: Instrumental Variables Regression50 Questions
Exam 13: Experiments and Quasi-Experiments50 Questions
Exam 14: Introduction to Time Series Regression and Forecasting50 Questions
Exam 15: Estimation of Dynamic Causal Effects50 Questions
Exam 16: Additional Topics in Time Series Regression50 Questions
Exam 17: The Theory of Linear Regression With One Regressor49 Questions
Exam 18: The Theory of Multiple Regression50 Questions
Select questions type
You have collected quarterly data on inflation and unemployment rates for Canada from 1961:III to 1995:IV to estimate a VAR(4)model of the change in the rate of inflation and the unemployment rate.The results are  t = 1.02 - .54 ΔInft-1 - .46 ΔInft-2 - .32 ΔInft-2 - .01 ΔInft-4
.09)(.09)(.09)(.08)(.44)
-.76 Unempt-1 + .20 Unempt-2 - .16 Unempt-3 + .59 Unempt-4
(.43)(.76)(.76)(.44)
t = 1.02 - .54 ΔInft-1 - .46 ΔInft-2 - .32 ΔInft-2 - .01 ΔInft-4
.09)(.09)(.09)(.08)(.44)
-.76 Unempt-1 + .20 Unempt-2 - .16 Unempt-3 + .59 Unempt-4
(.43)(.76)(.76)(.44)  = .26.
  t = 0.18 - .003 ΔInft-1 - .016 ΔInft-2 - .018 ΔInft-3 - .010 ΔInft-4
(.10)(.016)(.018)(.017)(.016)
+ 1.47 Unempt-1 - .46 Unempt-2 - .08 Unempt-3 + .05 Unempt-4
(.08)(.14)(.14)(.08)
t = 0.18 - .003 ΔInft-1 - .016 ΔInft-2 - .018 ΔInft-3 - .010 ΔInft-4
(.10)(.016)(.018)(.017)(.016)
+ 1.47 Unempt-1 - .46 Unempt-2 - .08 Unempt-3 + .05 Unempt-4
(.08)(.14)(.14)(.08)  = .980.
(a)Explain how you would use the above regressions to conduct one period ahead forecasts.
(b)Should you test for cointegration between the change in the inflation rate and the unemployment rate and,in the case of finding cointegration here,respecify the above model as a VECM?
(c)The Granger causality test yields the following F-statistics: 3.75 for the test that the coefficients on lagged unemployment rate in the change of inflation equation are all zero;and 0.36 for the test that the coefficients on lagged changes in the inflation rate are all zero.Based on these results,does unemployment Granger-cause inflation? Does inflation Granger-cause unemployment?
= .980.
(a)Explain how you would use the above regressions to conduct one period ahead forecasts.
(b)Should you test for cointegration between the change in the inflation rate and the unemployment rate and,in the case of finding cointegration here,respecify the above model as a VECM?
(c)The Granger causality test yields the following F-statistics: 3.75 for the test that the coefficients on lagged unemployment rate in the change of inflation equation are all zero;and 0.36 for the test that the coefficients on lagged changes in the inflation rate are all zero.Based on these results,does unemployment Granger-cause inflation? Does inflation Granger-cause unemployment?
(Essay)
4.9/5  (31)
(31)
You have re-estimated the two variable VAR model of the change in the inflation rate and the unemployment rate presented in your textbook using the sample period 1982:I (first quarter)to 2009:IV.To see if the conclusions regarding Granger causality of changed,you conduct an F-test for this new sample period.The results are as follows: The F-statistic testing the null hypothesis that the coefficients on Unempt-1,Unempt-2,Unempt-3,and Unemplt-4 are zero in the inflation equation (Equation 16.5 in your textbook)is 6.04.The F-statistic testing the hypothesis that the coefficients on the four lags of ΔInft are zero in the unemployment equation (Equation 16.6 in your textbook)is 0.80.
a.What is the critical value of the F-statistic in both cases?
b.Do you think that the unemployment rate Granger-causes changes in the inflation rate?
c.Do you think that the change in the inflation rate Granger-causes the unemployment rate?
(Essay)
4.7/5 (41)
There has been much talk recently about the convergence of inflation rates between many of the OECD economies.You want to see if there is evidence of this closer to home by checking whether or not Canada's inflation rate and the United States' inflation rate are cointegrated.
(a)You begin your numerical analysis by testing for a stochastic trend in the variables,using an Augmented Dickey-Fuller test.The t-statistic for the coefficient of interest is as follows:
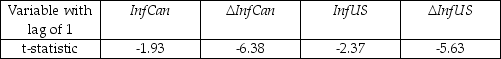 where InfCan is the Canadian inflation rate,and InfUS is the United States inflation rate.The estimated equation included an intercept.For each case make a decision about the stationarity of the variables based on the critical value of the Augmented Dickey-Fuller test statistic.
(b)Your test for cointegration results in a EG-ADF statistic of (-7.34).Can you reject the null hypothesis of a unit root for the residuals from the cointegrating regression?
(c)Using a working hypothesis that the two inflation rates are cointegrated,you want to test whether or not the slope coefficient equals one.To do so you estimate the cointegrating equation using the DOLS estimator with HAC standard errors.The coefficient on the U.S.inflation rate has a value of 0.45 with a standard error of 0.13.Can you reject the null hypothesis that the slope equals unity?
(d)Even if you could not reject the null hypothesis of a unit slope,would that have been sufficient evidence to establish convergence?
where InfCan is the Canadian inflation rate,and InfUS is the United States inflation rate.The estimated equation included an intercept.For each case make a decision about the stationarity of the variables based on the critical value of the Augmented Dickey-Fuller test statistic.
(b)Your test for cointegration results in a EG-ADF statistic of (-7.34).Can you reject the null hypothesis of a unit root for the residuals from the cointegrating regression?
(c)Using a working hypothesis that the two inflation rates are cointegrated,you want to test whether or not the slope coefficient equals one.To do so you estimate the cointegrating equation using the DOLS estimator with HAC standard errors.The coefficient on the U.S.inflation rate has a value of 0.45 with a standard error of 0.13.Can you reject the null hypothesis that the slope equals unity?
(d)Even if you could not reject the null hypothesis of a unit slope,would that have been sufficient evidence to establish convergence?
(Essay)
4.8/5 (34)
The lag length in a VAR using the BIC proceeds as follows: Among a set of candidate values of p,the estimated lag length xxxis the value of p
(Multiple Choice)
4.9/5 (37)
Purchasing power parity (PPP),postulates that the exchange rate between two countries equals the ratio of the respective price indexes or ExchRate =  (where ExchRate is the foreign exchange rate between the two countries,and P represents the price index,with f indicating the foreign country).The long-run version of PPP implies that that the exchange rate and the price ratio share a common trend.
(a)You collect monthly foreign exchange rate data from 1974:1 to 2002:4 for the U.S./U.K.exchange rate ($/£)and you collect data on the Consumer Price Index for both countries.Explain how you would used the Engle-Granger test statistic to investigate the long-run PPP hypothesis.
(b)One of your peers explains that there may be an easier way to test for the validity of PPP.She suggests to simply test whether or not the "real" exchange rate,or competitiveness,is stationary.(The real exchange rate is given by ExchRate ×
(where ExchRate is the foreign exchange rate between the two countries,and P represents the price index,with f indicating the foreign country).The long-run version of PPP implies that that the exchange rate and the price ratio share a common trend.
(a)You collect monthly foreign exchange rate data from 1974:1 to 2002:4 for the U.S./U.K.exchange rate ($/£)and you collect data on the Consumer Price Index for both countries.Explain how you would used the Engle-Granger test statistic to investigate the long-run PPP hypothesis.
(b)One of your peers explains that there may be an easier way to test for the validity of PPP.She suggests to simply test whether or not the "real" exchange rate,or competitiveness,is stationary.(The real exchange rate is given by ExchRate ×  )Is she correct? Explain.How would you implement her suggestion? Which alternative test-statistic is available?
(Essay)
4.9/5 (41)
Filters
- Essay(0)
- Multiple Choice(0)
- Short Answer(0)
- True False(0)
- Matching(0)