Exam 18: Statistical Process Control
Exam 1: Operations and Productivity126 Questions
Exam 2: Operations Strategy in a Global Environment135 Questions
Exam 3: Project Management122 Questions
Exam 4: Forecasting144 Questions
Exam 5: Design of Goods and Services137 Questions
Exam 6: Managing Quality130 Questions
Exam 18: Statistical Process Control156 Questions
Exam 7: Process Strategy and Sustainability131 Questions
Exam 19: Capacity and Constraint Management107 Questions
Exam 8: Location Strategies140 Questions
Exam 9: Layout Strategies161 Questions
Exam 10: Human Resources,job Design,and Work Measurement192 Questions
Exam 11: Supply-Chain Management145 Questions
Exam 20: Outsourcing As a Supply-Chain Strategy73 Questions
Exam 12: Inventory Management171 Questions
Exam 13: Aggregate Planning134 Questions
Exam 14: Material Requirements Planning Mrpand Erp169 Questions
Exam 15: Short-Term Scheduling139 Questions
Exam 16: Jit and Lean Operations138 Questions
Exam 17: Maintenance and Reliability130 Questions
Exam 21: Decision-Making Tools97 Questions
Exam 22: Linear Programming100 Questions
Exam 23: Transportation Models94 Questions
Exam 24: Waiting-Line Models135 Questions
Exam 25: Learning Curves111 Questions
Exam 26: Simulation92 Questions
Select questions type
Ten samples of a process measuring the number of returns per 100 receipts were taken for a local retail store.The number of returns were 10,9,11,7,3,12,8,4,6,11.Find the standard deviation of the sampling distribution.(Hint- Use p-bar formula)
(Multiple Choice)
4.8/5  (25)
(25)
Mean charts and range charts complement one another,one detecting shifts in process average,the other detecting shifts in process dispersion.
(True/False)
4.9/5 (38)
A quality analyst wants to construct a sample mean chart for controlling a packaging process.He knows from past experience that the process standard deviation is two ounces.Each day last week,he randomly selected four packages and weighed each.The data from that activity appears below. 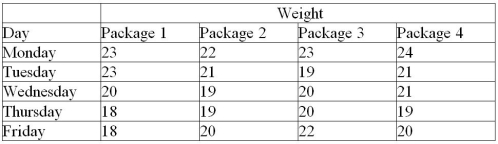 (a)Calculate all sample means and the mean of all sample means.
(b)Calculate upper and lower control limits that allow for natural variations.
(c)Is this process in control?
(a)Calculate all sample means and the mean of all sample means.
(b)Calculate upper and lower control limits that allow for natural variations.
(c)Is this process in control?
(Essay)
4.7/5 (35)
Define consumer's risk.How does it relate to the errors of hypothesis testing? What is the symbol for its value?
(Essay)
4.8/5 (29)
The upper and lower limits for diving ring diameters made by John's Swimming are 40 and 39 cm.John took 11 samples with the following average diameters (39,39.1,39.2,39.3,39.4,39.5 39.6,39.7,39.8,39.9,40).Is the process in control?
(Multiple Choice)
4.7/5 (33)
A bank's manager has videotaped 20 different teller transactions to observe the number of mistakes being made.Ten transactions had no mistakes,five had one mistake and five had two mistakes.Compute proper control limits at the 90% confidence level.
(Essay)
4.9/5 (40)
The usual purpose of an R-chart is to signal whether there has been a
(Multiple Choice)
4.7/5 (35)
The higher the process capability ratio,the greater the likelihood that process will be within design specifications.
(True/False)
4.9/5 (39)
The mean and standard deviations for a process are μ= 90 and σ = 9.For the variable control chart,a sample size of 16 will be used.Calculate the standard deviation of the sampling distribution.
(Essay)
4.8/5 (36)
The purpose of process control is to detect when natural causes of variation are present.
(True/False)
4.8/5 (35)
The type of inspection that classifies items as being either good or defective is
(Multiple Choice)
4.8/5 (45)
Which of the following is true regarding the process capability index Cpk?
(Multiple Choice)
4.8/5 (43)
A nationwide parcel delivery service keeps track of the number of late deliveries (more than 30 minutes past the time promised to clients)per day.They plan on using a control chart to plot their results.Which type of control chart(s)would you recommend?
(Multiple Choice)
4.8/5 (33)
Examine the Statistical Process Control outputs below.Answer the following questions.
a.What is the sample size?
b.What is the number of samples?
c.What is the mean of sample 8;what is the range of sample 10?
d.Is this process in control? Explain-a simple Yes or No is insufficient.
e.What additional steps should the quality assurance team take? 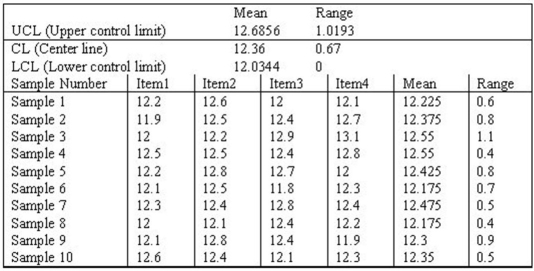
(Essay)
4.9/5 (30)
________ is a method of measuring samples of lots or batches of product against predetermined standards.
(Essay)
4.9/5 (33)
A(n)________ is a graph that describes how well an acceptance plan discriminates between good and bad lots.
(Essay)
4.8/5 (34)
The defect rate for a product has historically been about 1.6%.What are the upper and lower control chart limits for a p-chart,if you wish to use a sample size of 100 and 3-sigma limits?
(Essay)
4.9/5 (41)
Filters
- Essay(0)
- Multiple Choice(0)
- Short Answer(0)
- True False(0)
- Matching(0)