Exam 19: Statistical Process Control
Exam 1: Operations and Productivity127 Questions
Exam 2: The Global Environment and Operations Strategy119 Questions
Exam 3: Managing Projects120 Questions
Exam 4: Forecasting Demand140 Questions
Exam 5: Product Design118 Questions
Exam 6: Quality Management and International Standards123 Questions
Exam 7: Process Design108 Questions
Exam 8: Location Decisions121 Questions
Exam 9: Layout Decisions146 Questions
Exam 10: Job Design and Work Measurement154 Questions
Exam 11: Supply Chain Management145 Questions
Exam 12: Managing Inventory163 Questions
Exam 13: Aggregate Scheduling116 Questions
Exam 14: Material Requirements Planning Mrpand Erp113 Questions
Exam 15: Scheduling for the Short-Term116 Questions
Exam 16: Jit,lean Operations,and the Toyota Production System115 Questions
Exam 17: Maintenance and Reliability Decisions111 Questions
Exam 18: Sustainability80 Questions
Exam 19: Statistical Process Control144 Questions
Exam 20: Capacity Planning96 Questions
Exam 21: Supply Chain Modeling55 Questions
Exam 22: Decision Modeling97 Questions
Exam 23: Linear Programming Models88 Questions
Exam 24: Transportation Modeling89 Questions
Exam 25: Queuing Models119 Questions
Exam 26: Learning Curves110 Questions
Exam 27: Modeling with Simulation75 Questions
Select questions type
The usual purpose of an R-chart is to signal whether there has been a:
(Multiple Choice)
4.8/5  (34)
(34)
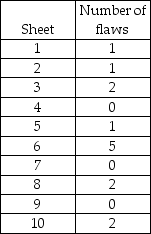
McDaniel Shipyards wants to develop a control chart to assess the quality of its steel plate.They take ten sheets of 1" steel plate and compute the number of cosmetic flaws on each roll.Each sheet is 20' by 100'.Based on the following data,develop limits for the 3-sigma control chart,plot the control chart,and determine whether the process is in control.
(Essay)
4.8/5 (38)
Which of the following is true regarding the relationship between AOQ and the true population percent defective?
(Multiple Choice)
4.9/5 (46)
The causes of variation in statistical process control are:
(Multiple Choice)
4.9/5 (36)
A process is said to be in statistical control when assignable causes are the only sources of variation.
(True/False)
4.8/5 (41)
When a lot has been accepted by acceptance sampling,we know that:
(Multiple Choice)
4.9/5 (46)
The Central Limit Theorem states that when the sample size increases,the distribution of the sample means will approach the normal distribution.
(True/False)
4.9/5 (38)
A hospital-billing auditor has been inspecting patient bills.While almost all bills contain some errors,the auditor is looking now for large errors (errors in excess of $250).Each day last week,the auditor examined 100 bills and found an average defect rate of 16%.Calculate the upper and lower limits for the billing process for 99.73% confidence.
(Essay)
4.9/5 (29)
A c-chart is appropriate to plot the number of flaws in a bolt of fabric.
(True/False)
4.8/5 (36)
Repeated sampling of a certain process shows the average of all sample ranges to be 1.0 cm.The sample size has been constant at n = 5.What are the 3-sigma control limits for this R-chart?
(Essay)
4.8/5 (34)
If the process average is in control,then the process range must also be in control.
(True/False)
4.9/5 (34)
The term ________ is used to describe how well a process makes units within design specifications (or tolerances).
(Essay)
4.8/5 (42)
Examine the Statistical Process Control outputs below.Answer the following questions.
a.What is the sample size?
b.What is the number of samples?
c.What is the mean of sample 8;what is the range of sample 10?
d..Is this process in control? Explain--a simple Yes or No is insufficient.
e.What additional steps should the quality assurance team take? 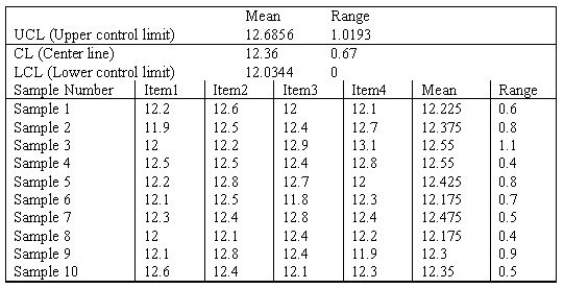
(Essay)
4.8/5 (35)
The ________ is a quality control chart that indicates when changes occur in the central tendency of a production process.
(Essay)
4.8/5 (41)
A manager wishes to build a 3-sigma range chart for a process.The sample size is five,the mean of sample means is 16.01,and the average range is 5.3.From Table S6.1,the appropriate value of D3 is 0,and D4 is 2.115.What are the UCL and LCL,respectively,for this range chart?
(Multiple Choice)
4.7/5 (26)
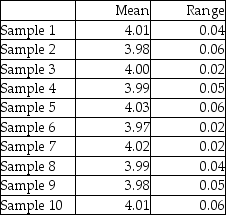
A part that connects two levels should have a distance between the two holes of 4".It has been determined that x-bar and R-charts should be set up to determine if the process is in statistical control.The following ten samples of size four were collected.Calculate the control limits,plot the control charts,and determine if the process is in control.
(Essay)
4.9/5 (34)
A process that is assumed to be in control with limits of 89 ± 2 had sample averages for the x-bar chart of the following: 87.1,87,87.2,89,90,88.5,89.5,and 88.Is the process in control?
(Multiple Choice)
4.8/5 (36)
Filters
- Essay(0)
- Multiple Choice(0)
- Short Answer(0)
- True False(0)
- Matching(0)