Exam 19: Statistical Process Control
Exam 1: Operations and Productivity127 Questions
Exam 2: The Global Environment and Operations Strategy119 Questions
Exam 3: Managing Projects120 Questions
Exam 4: Forecasting Demand140 Questions
Exam 5: Product Design118 Questions
Exam 6: Quality Management and International Standards123 Questions
Exam 7: Process Design108 Questions
Exam 8: Location Decisions121 Questions
Exam 9: Layout Decisions146 Questions
Exam 10: Job Design and Work Measurement154 Questions
Exam 11: Supply Chain Management145 Questions
Exam 12: Managing Inventory163 Questions
Exam 13: Aggregate Scheduling116 Questions
Exam 14: Material Requirements Planning Mrpand Erp113 Questions
Exam 15: Scheduling for the Short-Term116 Questions
Exam 16: Jit,lean Operations,and the Toyota Production System115 Questions
Exam 17: Maintenance and Reliability Decisions111 Questions
Exam 18: Sustainability80 Questions
Exam 19: Statistical Process Control144 Questions
Exam 20: Capacity Planning96 Questions
Exam 21: Supply Chain Modeling55 Questions
Exam 22: Decision Modeling97 Questions
Exam 23: Linear Programming Models88 Questions
Exam 24: Transportation Modeling89 Questions
Exam 25: Queuing Models119 Questions
Exam 26: Learning Curves110 Questions
Exam 27: Modeling with Simulation75 Questions
Select questions type
The specification for a plastic handle calls for a length of 6.0 inches ± .2 inches.The standard deviation of the process is estimated to be 0.05 inches.What are the upper and lower specification limits for this product? The process is known to operate at a mean thickness of 6.1 inches.What are the Cp and Cpk values for this process? Is this process capable of producing the desired part?
(Essay)
4.8/5  (40)
(40)
A local manufacturer supplies you with parts,and you would like to install a quality monitoring system at his factory for these parts.Historically,the defect rate for these parts has been 1.25 percent (You've observed this from your acceptance sampling procedures,which you would like to discontinue).Develop ± 3σ control limits for this process.Assume the sample size will be 200 items.
(Essay)
4.8/5 (37)
Mistakes stemming from workers' inadequate training represent an assignable cause of variation.
(True/False)
4.8/5 (46)
The steeper an OC curve,the better it discriminates between good and bad lots.
(True/False)
4.9/5 (42)
What are the three possible results (or findings)from the use of control charts?
(Essay)
4.7/5 (47)
The number of late insurance claim payouts per 100 should be measured with what type of control chart?
(Multiple Choice)
4.8/5 (24)
Larry's boat shop wants to monitor the number of blemishes in the paint of each boat.Construct a 3-sigma c-chart to determine if their paint process is in control using the following data.
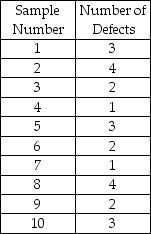
(Essay)
4.8/5 (40)
What is the difference between natural and assignable causes of variation?
(Essay)
4.8/5 (39)
The defect rate for a product has historically been about 1.6%.What are the upper and lower control chart limits for a p-chart,if you wish to use a sample size of 100 and 3-sigma limits?
(Essay)
4.8/5 (39)
A p-chart is appropriate to plot the number of typographic errors per page of text.
(True/False)
4.8/5 (37)
The acceptable quality level (AQL)is the average level of quality we are willing to accept.
(True/False)
4.9/5 (38)
The ________ is the lowest level of quality that we are willing to accept.
(Essay)
4.9/5 (45)
The probability of rejecting a good lot is known as consumer's risk.
(True/False)
4.8/5 (36)
A quality analyst wants to construct a sample mean chart for controlling a packaging process.He knows from past experience that the process standard deviation is two ounces.Each day last week,he randomly selected four packages and weighed each.The data from that activity appear below.
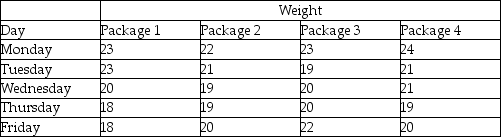 (a)Calculate all sample means and the mean of all sample means.
(b)Calculate upper and lower 2-sigma x-bar chart control limits that allow for natural variations.
(c)Based on the x-bar chart,is this process in control?
(a)Calculate all sample means and the mean of all sample means.
(b)Calculate upper and lower 2-sigma x-bar chart control limits that allow for natural variations.
(c)Based on the x-bar chart,is this process in control?
(Essay)
4.9/5 (37)
At your first job out of college you have been assigned to the production of bottled 20 oz.soda.
The process has upper and lower spec limits of 20.5 and 19.5 oz,respectively,with a mean of 19.8 oz
and standard deviation of .1 oz.Your manager has requested the process produce no more than 3.4
defects per 1 million bottles produced.Calculate Cpk and then determine if the process is capable according to the manager's standard.
(Essay)
4.9/5 (30)
The width of a bronze bar is intended to be one-eighth of an inch (0.125 inches).Inspection samples contain five bars each.The average range of these samples is 0.01 inches.What are the upper and lower control limits for the x-bar and R-chart for this process,using 3-sigma limits?
(Essay)
4.8/5 (37)
Cartons of Plaster of Paris are supposed to weigh exactly 32 oz.Inspectors want to develop process control charts.They take ten samples of six boxes each and weigh them.Based on the following data,compute the lower and upper control limits and determine whether the process is in control.
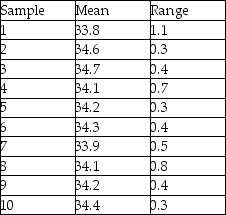
(Essay)
4.8/5 (41)
Filters
- Essay(0)
- Multiple Choice(0)
- Short Answer(0)
- True False(0)
- Matching(0)