Exam 19: Statistical Process Control
Exam 1: Operations and Productivity127 Questions
Exam 2: The Global Environment and Operations Strategy119 Questions
Exam 3: Managing Projects120 Questions
Exam 4: Forecasting Demand140 Questions
Exam 5: Product Design118 Questions
Exam 6: Quality Management and International Standards123 Questions
Exam 7: Process Design108 Questions
Exam 8: Location Decisions121 Questions
Exam 9: Layout Decisions146 Questions
Exam 10: Job Design and Work Measurement154 Questions
Exam 11: Supply Chain Management145 Questions
Exam 12: Managing Inventory163 Questions
Exam 13: Aggregate Scheduling116 Questions
Exam 14: Material Requirements Planning Mrpand Erp113 Questions
Exam 15: Scheduling for the Short-Term116 Questions
Exam 16: Jit,lean Operations,and the Toyota Production System115 Questions
Exam 17: Maintenance and Reliability Decisions111 Questions
Exam 18: Sustainability80 Questions
Exam 19: Statistical Process Control144 Questions
Exam 20: Capacity Planning96 Questions
Exam 21: Supply Chain Modeling55 Questions
Exam 22: Decision Modeling97 Questions
Exam 23: Linear Programming Models88 Questions
Exam 24: Transportation Modeling89 Questions
Exam 25: Queuing Models119 Questions
Exam 26: Learning Curves110 Questions
Exam 27: Modeling with Simulation75 Questions
Select questions type
A(n)________ is a graph that describes how well an acceptance plan discriminates between good and bad lots.
(Essay)
4.9/5  (31)
(31)
To set x-bar chart upper and lower control limits,one must know the process central line,which is the:
(Multiple Choice)
4.7/5 (32)
The mean and standard deviations for a process are μ = 90 and σ = 9,respectively.For the variable control chart,a sample size of 16 will be used.Calculate the standard deviation of the sample means.
(Essay)
4.9/5 (47)
Ten samples of a process measuring the number of returns per 100 receipts were taken for a local retail store.The number of returns were 10,9,11,7,3,12,8,4,6,and 11.Find the standard deviation of the sampling distribution for the p-bar chart.
(Multiple Choice)
4.7/5 (41)
Up to three standard deviations above or below the centerline is the amount of variation that statistical process control allows for:
(Multiple Choice)
4.9/5 (35)
The specifications for a manifold gasket that installs between two engine parts calls for a thickness of 2.500 mm ± .020 mm.The standard deviation of the process is estimated to be 0.004 mm.The process is currently operating at a mean thickness of 2.50 mm.(a)What are the upper and lower specification limits for this product? (b)What is the Cp for this process? (c)The purchaser of these parts requires a capability index of 1.50.Is this process capable? Is this process good enough for the supplier? (d)If the process mean were to drift from its setting of 2.500 mm to a new mean of 2.497,would the process still be good enough for the supplier's needs?
(Essay)
4.8/5 (40)
The statistical definition of Six Sigma allows for 3.4 defects per million.This is achieved by what Cpk index value?
(Multiple Choice)
4.8/5 (36)
An acceptance sampling plan's ability to discriminate between low quality lots and high quality lots is described by:
(Multiple Choice)
4.7/5 (32)
Averages of small samples,not individual measurements,are generally used in statistical process control.
(True/False)
4.9/5 (38)
A department chair wants to monitor the percentage of failing students in classes in her department.Each class had an enrollment of 50 students last spring.The number of failing students in the 10 classes offered that term were 1,4,2,0,0,0,0,0,0,and 3,respectively.Compute the control limits for a p-chart at the 95% confidence level.Is the process in control?
(Essay)
4.8/5 (40)
Ten samples of size four were taken from a process,and their weights measured.The sample averages and sample ranges are in the following table.Construct and plot an x-bar and R-chart using these data.Is the process in control?
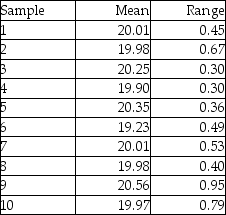
(Essay)
4.9/5 (31)
A process is operating in such a manner that the mean of the process is exactly on the lower specification limit.What must be true about the two measures of capability for this process?
(Essay)
4.8/5 (32)
The ________ is a quality control chart used to control the number of defects per unit of output.
(Essay)
4.8/5 (39)
The higher the process capability ratio,the greater the likelihood that process will be within design specifications.
(True/False)
4.8/5 (41)
Filters
- Essay(0)
- Multiple Choice(0)
- Short Answer(0)
- True False(0)
- Matching(0)