Exam 5: Quality and Performance
Exam 1: Using Operations to Compete107 Questions
Exam 2: Project Management151 Questions
Exam 3: Process Strategy149 Questions
Exam 4: Process Analysis192 Questions
Exam 5: Quality and Performance223 Questions
Exam 6: Capacity Planning133 Questions
Exam 7: Constraint Management160 Questions
Exam 8: Lean Systems179 Questions
Exam 9: Supply Chain Inventory Management216 Questions
Exam 10: Supply Chain Design93 Questions
Exam 11: Supply Chain Location Decisions126 Questions
Exam 12: Supply Chain Integration130 Questions
Exam 13: Supply Chain Sustainability and Humanitarian Logistics77 Questions
Exam 14: Forecasting183 Questions
Exam 15: Operations Planning and Scheduling191 Questions
Exam 16: Resource Planning149 Questions
Exam 17: Decision Making118 Questions
Exam 18: Waiting Line127 Questions
Exam 19: Special Inventory Models53 Questions
Exam 20: Linear Programming84 Questions
Exam 21: Simulation61 Questions
Exam 22: Financial Analysis60 Questions
Exam 23: Acceptance Sampling Plans88 Questions
Exam 24: Measuring Output Rates103 Questions
Exam 25: Learning Curve Analysis56 Questions
Exam 26: Operations Scheduling131 Questions
Select questions type
The UCL and LCL for an  chart are 25 and 15 respectively.The central line is 20,and the process variability is considered to be in statistical control.The results of the next six sample means are 18,23,17,21,24,and 16.What should you do?
(Multiple Choice)
4.8/5  (32)
(32)
A company is interested in monitoring the number of scratches on Plexiglass panels.The appropriate control chart to use would be:
(Multiple Choice)
4.9/5 (40)
A drilling and deburring process has tolerances of plus or minus .001 millimeters.What does the process standard deviation need to be in order for this process to have a capability ratio of 1.67?
(Multiple Choice)
4.9/5 (42)
The poultry farmer was aghast when the grocery store revealed their new weapon in the war on poor quality.They planned to use a(n)________ to monitor the rotten eggs found in the cartons of farm fresh free range eggs that he supplied.The poultry farmer was well-versed in quality and knew their choice to be the right one;nevertheless he was upset about this level of scrutiny and what he perceived as a lack of trust.
(Essay)
4.8/5 (35)
The upper and lower specification limits for a component are 3.98 and 4.02 inches,respectively.The process standard deviation is .004,and the process average is 4.005 inches.Is this process capable of achieving four-sigma performance (the four-sigma performance target value is 1.33)?
(Essay)
4.9/5 (38)
When considering the plan-do-study-act cycle for problem solving,evaluating how closely a project's results correspond to the initial goals set for the work is part of the ________ step.
(Multiple Choice)
4.9/5 (37)
________ is the societal effect that is factored into decisions involving the production of goods and services that goes beyond other cost of quality measures.
(Essay)
4.7/5 (37)
The defect rate for a product has historically been about 2.0%.What are the upper and lower control chart limits if you wish to use a sample size of 100 and 3-sigma limits?
(Essay)
4.7/5 (41)
Which of the following can be used to eliminate "common" causes of variation?
(Multiple Choice)
4.8/5 (37)
What are any three dimensions of quality and which one accurately describes how you assess education?
(Essay)
4.7/5 (43)
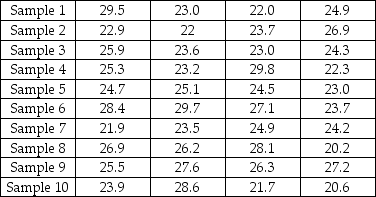
Table 5.2 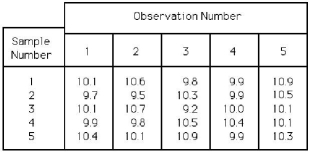 -Using Table 5.2,the sample values represent service times in minutes.For the R-chart,what is the value of UCLR?
(Multiple Choice)
4.9/5 (41)
The advantage of variable measurements is that they can be quickly counted compared to attribute measurements.
(True/False)
4.8/5 (49)
Samples of size four were taken from a process that had a target of 25 ounces with upper and lower specification limits of 30 ounces and 20 ounces respectively.Create the appropriate control charts and determine whether the process is in control.Then compute process capability.
(Essay)
4.9/5 (36)
Table 5.2
-Using Table 5.2,for the  chart,what is the value of the upper control limit for the x-bar chart?
(Multiple Choice)
4.8/5 (30)
Table 5.1
Factors for Calculating Three-Sigma Limits for the  Chart and R-Chart
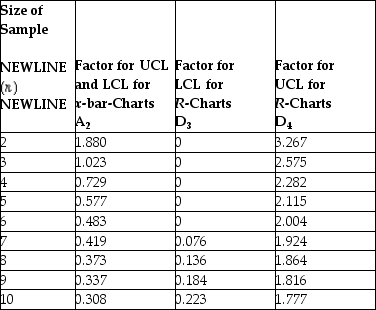 Source: 1950 ASTM Manual on Quality Control of Materials,copyright American Society for Testing Materials.Reprinted with permission.
-A milling operation has historically produced an average thickness of 0.005 inch with an average range of 0.0015 inch.Currently,the first three items from each batch of 20 are inspected.Use Table 5.1.What is the value of the lower control limit for the x-bar chart?
Source: 1950 ASTM Manual on Quality Control of Materials,copyright American Society for Testing Materials.Reprinted with permission.
-A milling operation has historically produced an average thickness of 0.005 inch with an average range of 0.0015 inch.Currently,the first three items from each batch of 20 are inspected.Use Table 5.1.What is the value of the lower control limit for the x-bar chart?
(Multiple Choice)
4.8/5 (39)
On a control chart,a type I error occurs when the employee concludes that the process is in control when it is actually out of statistical control.
(True/False)
4.7/5 (37)
In acceptance sampling,the proportion defective that the buyer will allow in an incoming shipment is:
(Multiple Choice)
4.8/5 (35)
A firm's internal program in employee involvement includes which of the following considerations?
(Multiple Choice)
4.9/5 (35)
Filters
- Essay(0)
- Multiple Choice(0)
- Short Answer(0)
- True False(0)
- Matching(0)