Exam 12: Project Management
Exam 1: Introduction to Quantitative Analysis63 Questions
Exam 2: Probability Concepts and Applications145 Questions
Exam 3: Decision Analysis119 Questions
Exam 4: Regression Models120 Questions
Exam 5: Forecasting101 Questions
Exam 6: Inventory Control Models113 Questions
Exam 7: Linear Programming Models: Graphical and Computer Methods100 Questions
Exam 8: Linear Programming Applications96 Questions
Exam 9: Transportation and Assignment Models80 Questions
Exam 10: Integer Programming, Goal Programming, and Nonlinear Programming88 Questions
Exam 11: Network Models86 Questions
Exam 12: Project Management123 Questions
Exam 13: Waiting Lines and Queuing Theory Models133 Questions
Exam 14: Simulation Modeling68 Questions
Exam 15: Markov Analysis78 Questions
Exam 16: Statistical Quality Control87 Questions
Select questions type
Given an activity's optimistic, most likely, and pessimistic time estimates of 2, 5, and 14 days respectively, compute the PERT expected activity time for this activity.
(Multiple Choice)
4.9/5  (44)
(44)
In PERT, we assume that the project completion time can be modeled by the normal distribution.
(True/False)
4.9/5 (24)
PERT and CPM are quantitative analysis tools designed to schedule and control large projects.
(True/False)
4.8/5 (46)
Table 12-2
The following represents a project with four activities. All times are in weeks. 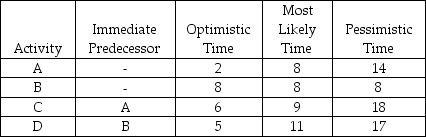 -According to Table 12-2, there are four activities in the project. Assume the normal distribution is appropriate to use to determine the probability of finishing by a particular time. What is the probability that the project is finished in 16 weeks or fewer? (Round to two decimals.)
(Multiple Choice)
4.9/5 (42)
Table 12-2
The following represents a project with four activities. All times are in weeks.
-According to Table 12-2, there are four activities in the project. Assume the normal distribution is appropriate to use to determine the probability of finishing by a particular time. If you wished to find the probability of finishing the project in 20 weeks or fewer, it would be necessary to find the variance and then the standard deviation to be used with the normal distribution. What variance would be used?
(Multiple Choice)
4.9/5 (33)
Table 12-1
The following represents a project with know activity times. All times are in weeks. 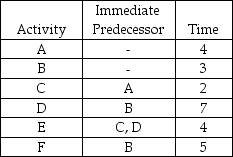 -Using the data in Table 12-1, what is the latest possible time that C may be started without delaying completion of the project?
(Multiple Choice)
4.8/5 (44)
Figure 12-1 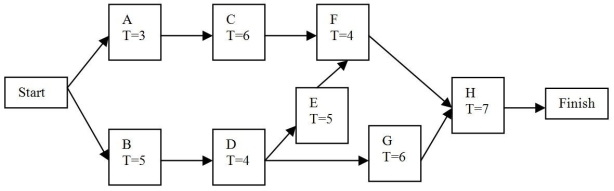 -Given the network in Figure 12-1, the critical path is
(Multiple Choice)
4.9/5 (37)
Figure 12-1
-Given the network shown in Figure 12-1 and the following information, what is the variance of the critical path? 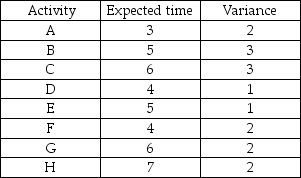
(Multiple Choice)
4.7/5 (36)
Managers use the network analysis of PERT and CPM to help them
(Multiple Choice)
4.7/5 (32)
Gantt charts and PERT diagrams provide the same information, just in different formats.
(True/False)
4.9/5 (36)
In CPM, crashing an activity that is not on the critical path increases the cost of the project.
(True/False)
4.9/5 (30)
Which of the following is not a decision variable when formulating the project crashing problem as a linear program?
(Multiple Choice)
4.8/5 (40)
Given the following small project, the critical path is ________ days. 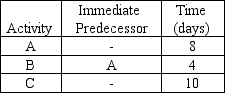
(Multiple Choice)
4.8/5 (32)
Given the assumptions in PERT, the probability that a project will be completed in less time than required by the activities on the critical path is approximately 50%.
(True/False)
4.9/5 (35)
The project described by: 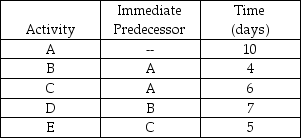 is best represented by which of the following networks?
(Multiple Choice)
4.9/5 (36)
The two common techniques for drawing PERT networks are ________.
(Multiple Choice)
4.8/5 (39)
The longest time path through a PERT/CPM network is called the critical path.
(True/False)
4.7/5 (46)
Given an activity's optimistic, most likely, and pessimistic time estimates of 3, 5, and 15 days, respectively, compute the PERT standard deviation for this activity.
(Multiple Choice)
4.8/5 (40)
Gantt charts contain information about the time taken by each activity, but not about the sequential dependencies of the activities.
(True/False)
4.8/5 (35)
Filters
- Essay(0)
- Multiple Choice(0)
- Short Answer(0)
- True False(0)
- Matching(0)