Exam 3: Graphical Descriptive Techniques II
Exam 1: What Is Statistics39 Questions
Exam 2: Graphical Descriptive Techniques I89 Questions
Exam 3: Graphical Descriptive Techniques II179 Questions
Exam 4: A: Numerical Descriptive Techniques202 Questions
Exam 4: B: Numerical Descriptive Techniques39 Questions
Exam 4: C: Numerical Descriptive Techniques18 Questions
Exam 5: Data Collection and Sampling76 Questions
Exam 6: Probability223 Questions
Exam 7: A: Random Variables and Discrete Probability Distributions225 Questions
Exam 7: B: Random Variables and Discrete Probability Distributions44 Questions
Exam 8: Continuous Probability Distributions200 Questions
Exam 9: Sampling Distributions150 Questions
Exam 10: Introduction to Estimation143 Questions
Exam 11: Introduction to Hypothesis Testing179 Questions
Exam 12: Inference About a Population149 Questions
Exam 13: Inference About Comparing Two Populations169 Questions
Exam 14: Analysis of Variance154 Questions
Exam 15: Chi-Squared Tests174 Questions
Exam 16: A: Simple Linear Regression and Correlation246 Questions
Exam 16: B: Simple Linear Regression and Correlation47 Questions
Exam 17: Multiple Regression156 Questions
Exam 18: Model Building137 Questions
Exam 19: Nonparametric Statistics171 Questions
Exam 20: Time-Series Analysis and Forecasting217 Questions
Exam 21: Statistical Process Control133 Questions
Exam 22: Decision Analysis121 Questions
Exam 23: Conclusion45 Questions
Select questions type
Which of the following is the method statisticians use to draw the best fitting straight line through the data on a scatter diagram?
(Multiple Choice)
4.8/5  (35)
(35)
In a histogram,each observation is assigned to one or more classes.
(True/False)
4.8/5 (27)
Can a scatter diagram be used to explore the relationship between two nominal variables? Explain why or why not.
(Essay)
4.8/5 (36)
Observations that are taken during successive points in time are called ____________________ data.
(Essay)
4.8/5 (29)
Home Care
Data are collected on the number of house calls (x)made in a given week by each of 60 nurses in a certain hospital.The same data set is displayed in each of the three histograms below. 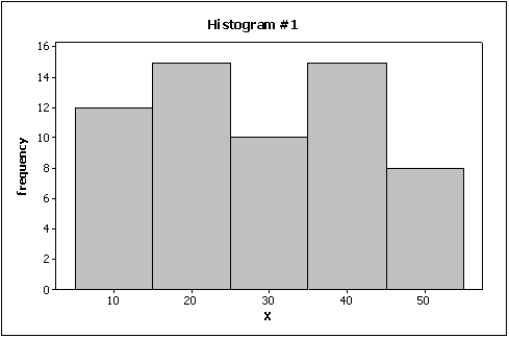
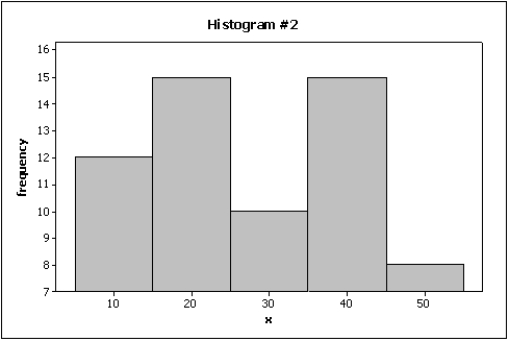
 -{Home Care Narrative} Which histogram makes the differences in the house calls appear to be the most dramatic?
(Essay)
4.9/5 (44)
The number of observations within each class may be found in a frequency distribution.
(True/False)
4.8/5 (39)
Internet Classes
A survey of 25 students was conducted to determine how they rate the quality of Internet classes.Students were asked to rate the overall quality from 0 (no quality at all)to 100 (extremely good quality).The stem-and-leaf display of the data is shown below.
Stem Leaves 3 15 4 01457889 5 0134677 6 24568 7 29 8 9 5
-{Internet Classes Narrative} What percentage of the students rated the overall quality of on-line classes as being below 40?
(Essay)
5.0/5 (31)
Teachers Ages
The ages (in years)of a sample of 25 teachers are as follows:
47 21 37 53 28 40 30 32 34 26 34 24 24 35 45 38 35 28 43 45 30 45 31 41 56
-{Teachers Ages Narrative} Draw a stem-and-leaf display of this data.What is the minimum and maximum age of the teachers in this data set?
(Essay)
4.7/5 (40)
The line chart below shows potato prices per pound for each month from January (month 1)to December last year.By looking at this chart you can see the lowest potato prices occurred in ____________________. 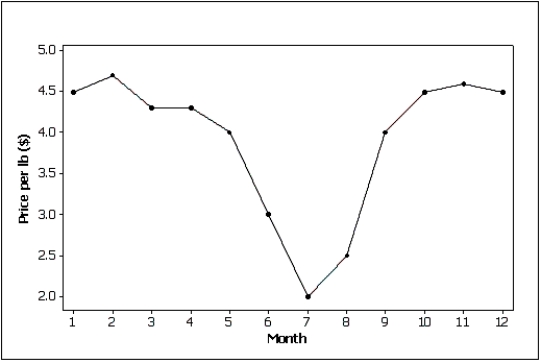
(Essay)
4.8/5 (36)
A department store's monthly sales (in thousands of dollars)for the last year were as follows.A histogram should be used to present these data.
Month 1 2 3 4 5 6 7 8 9 10 11 12 Sales 78 74 83 87 85 93 100 105 103 89 78 94
(Essay)
4.9/5 (35)
The two most important characteristics to examine in a scatter diagram are the number of possible categories for X and Y and the number of observations in each category.
(True/False)
4.9/5 (36)
A relative frequency distribution describes the proportion of data values that fall within each category.
(True/False)
4.8/5 (32)
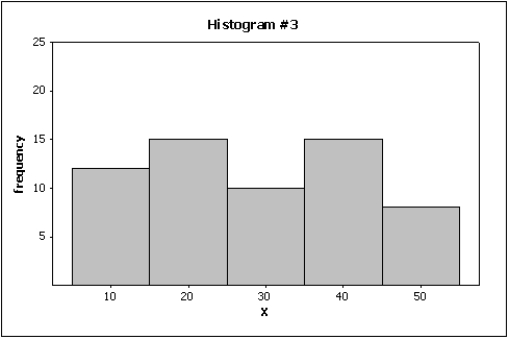
Home Care
Data are collected on the number of house calls (x)made in a given week by each of 60 nurses in a certain hospital.The same data set is displayed in each of the three histograms below.
-{Home Care Narrative} Which histogram makes the differences in the house calls appear to be the least dramatic?
(Essay)
4.8/5 (36)
Observations that are measured at the same time are called ____________________ data.
(Essay)
5.0/5 (41)
Insurance Company
A representative from a local insurance agency selected a random sample of insured homeowners and recorded the number of claims made in the last three years,with the following results:
Number of claims 0 1 2 3 4 5 Frequency 9 20 14 13 5 3
-{Insurance Company Narrative} What proportion of homeowners had no claims in the last three years?
(Essay)
4.9/5 (36)
According to the stem-and-leaf plot below,this data set has a negative median.
Stem-and-leaf of P/E ratio; N=75 Leaf Unit = 0.01 1 -2 6 2 -2 0 5 -1 555 8 -1 420 22 -0 9999988777665 36 -0 443221111111000 (14) 0 01122233333344 25 0 6667889999 14 1 0022222334 4 1 56 2 2 03
(True/False)
4.9/5 (27)
Filters
- Essay(0)
- Multiple Choice(0)
- Short Answer(0)
- True False(0)
- Matching(0)