Exam 3: Graphical Descriptive Techniques II
Exam 1: What Is Statistics39 Questions
Exam 2: Graphical Descriptive Techniques I89 Questions
Exam 3: Graphical Descriptive Techniques II179 Questions
Exam 4: A: Numerical Descriptive Techniques202 Questions
Exam 4: B: Numerical Descriptive Techniques39 Questions
Exam 4: C: Numerical Descriptive Techniques18 Questions
Exam 5: Data Collection and Sampling76 Questions
Exam 6: Probability223 Questions
Exam 7: A: Random Variables and Discrete Probability Distributions225 Questions
Exam 7: B: Random Variables and Discrete Probability Distributions44 Questions
Exam 8: Continuous Probability Distributions200 Questions
Exam 9: Sampling Distributions150 Questions
Exam 10: Introduction to Estimation143 Questions
Exam 11: Introduction to Hypothesis Testing179 Questions
Exam 12: Inference About a Population149 Questions
Exam 13: Inference About Comparing Two Populations169 Questions
Exam 14: Analysis of Variance154 Questions
Exam 15: Chi-Squared Tests174 Questions
Exam 16: A: Simple Linear Regression and Correlation246 Questions
Exam 16: B: Simple Linear Regression and Correlation47 Questions
Exam 17: Multiple Regression156 Questions
Exam 18: Model Building137 Questions
Exam 19: Nonparametric Statistics171 Questions
Exam 20: Time-Series Analysis and Forecasting217 Questions
Exam 21: Statistical Process Control133 Questions
Exam 22: Decision Analysis121 Questions
Exam 23: Conclusion45 Questions
Select questions type
If the data in a scatter diagram is scattered completely at random,what do you conclude?
(Multiple Choice)
4.8/5  (35)
(35)
A(n)____________________ is created by plotting the value of the variable on the vertical axis and the time periods on the horizontal axis.
(Essay)
4.8/5 (33)
Test scores
The scores on a calculus test for a random sample of 40 students are as follows:
63 74 42 65 51 54 36 56 68 57 62 64 76 67 79 61 81 77 59 38 84 68 71 94 71 86 69 75 91 55 48 82 83 54 79 62 68 58 41 47
-{Test Grades Narrative)Construct an ogive for this data set.Use the ogive to estimate the proportion of exam scores that are between 80 and 90.
(Essay)
4.8/5 (30)
A line chart showing the number of crimes in Las Vegas from 2000 to 2005 may exhibit a totally different trend than a line chart showing the crime rate in Las Vegas from 2000 to 2005.(Crime rate is defined as number of crimes per 100,000 people. )
(True/False)
4.8/5 (31)
In applications involving two variables,X and Y,where one variable depends to some degree on the other,we call X the ____________________ variable.
(Essay)
4.8/5 (33)
The relationship between two interval variables is graphically displayed by a
(Multiple Choice)
5.0/5 (36)
The effect of making the slope of a line chart appear steeper can be created by:
(Multiple Choice)
4.7/5 (45)
Data for calories and salt content (milligrams of sodium)in 17 brands of meat hot dogs are shown in the scatter diagram below.According to this diagram,it appears that hot dogs that are high in sodium are generally low in calories,and hot dogs with low sodium are generally high in calories. 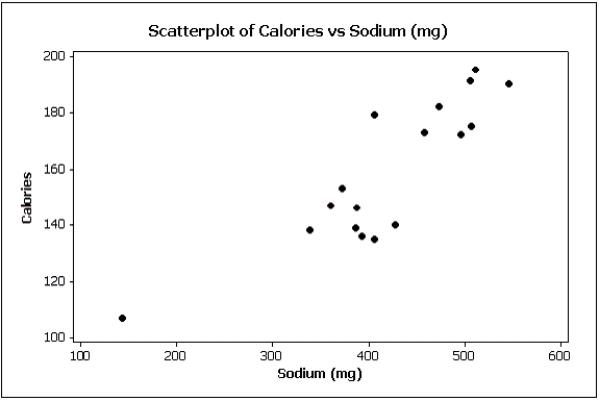
(True/False)
4.9/5 (29)
When a distribution has more values to the right and tails to the left,we say it is skewed negatively.
(True/False)
4.8/5 (29)
Internet Classes
A survey of 25 students was conducted to determine how they rate the quality of Internet classes.Students were asked to rate the overall quality from 0 (no quality at all)to 100 (extremely good quality).The stem-and-leaf display of the data is shown below.
Stem Leaves 3 15 4 01457889 5 0134677 6 24568 7 29 8 9 5
-{Internet Classes Narrative} What percentage of the students rated the overall quality of Internet classes as being 60 or below?
(Essay)
4.8/5 (35)
We determine the approximate width of the classes by subtracting the smallest observation from the largest and dividing the answer by the number of ____________________.
(Essay)
4.8/5 (36)
The scatter diagram below depicts data with a negative linear relationship. 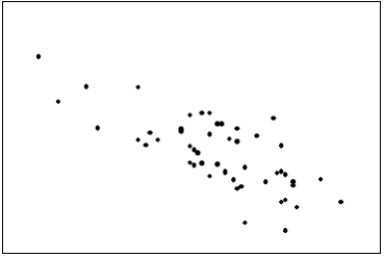
(True/False)
4.9/5 (31)
Internet Classes
A survey of 25 students was conducted to determine how they rate the quality of Internet classes.Students were asked to rate the overall quality from 0 (no quality at all)to 100 (extremely good quality).The stem-and-leaf display of the data is shown below.
Stem Leaves 3 15 4 01457889 5 0134677 6 24568 7 29 8 9 5
-{Internet Classes Narrative} What percentage of the students rated the overall quality of on-line classes as being between 50 and 75,inclusive?
(Essay)
4.8/5 (26)
The line chart below shows tomato prices each month from January (month 1)to December last year ($ per pound).By looking at this chart you can see the lowest tomato prices occurred in July. 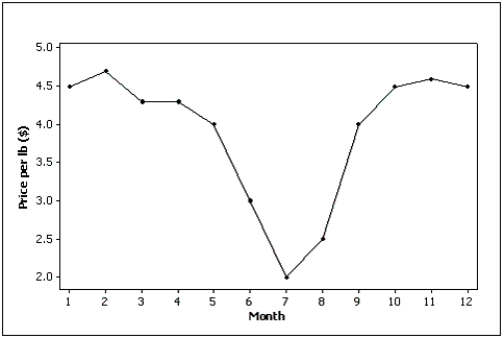
(True/False)
4.7/5 (40)
Test scores
The scores on a calculus test for a random sample of 40 students are as follows:
63 74 42 65 51 54 36 56 68 57 62 64 76 67 79 61 81 77 59 38 84 68 71 94 71 86 69 75 91 55 48 82 83 54 79 62 68 58 41 47
-A supermarket's monthly sales (in thousands of dollars)for the last year were as follows:
Month 1 2 3 4 5 6 7 8 9 10 11 12 Sales 78 74 83 87 85 93 100 105 103 89 78 94 Construct a relative frequency bar chart for this data set.How many observations are there in this data set?
(Essay)
4.8/5 (29)
Test scores
The scores on a calculus test for a random sample of 40 students are as follows:
63 74 42 65 51 54 36 56 68 57 62 64 76 67 79 61 81 77 59 38 84 68 71 94 71 86 69 75 91 55 48 82 83 54 79 62 68 58 41 47
-{Test Grade Narrative} Construct a relative frequency histogram for this data set and discuss its shape.
(Essay)
4.9/5 (33)
Graphical techniques should not be used to present data if accurate tabular forms for the same data are available.
(True/False)
4.7/5 (40)
Filters
- Essay(0)
- Multiple Choice(0)
- Short Answer(0)
- True False(0)
- Matching(0)