Exam 53: Population Ecology
Exam 1: Evolution, the Themes of Biology, and Scientific Inquiry51 Questions
Exam 2: The Chemical Context of Life61 Questions
Exam 3: Water and Life55 Questions
Exam 4: Carbon and the Molecular Diversity of Life58 Questions
Exam 5: The Structure and Function of Large Biological Molecules70 Questions
Exam 6: A Tour of the Cell66 Questions
Exam 7: Membrane Structure and Function68 Questions
Exam 8: An Introduction to Metabolism67 Questions
Exam 9: Cellular Respiration and Fermentation68 Questions
Exam 10: Photosynthesis65 Questions
Exam 11: Cell Communication65 Questions
Exam 12: The Cell Cycle66 Questions
Exam 13: Meiosis and Sexual Life Cycles64 Questions
Exam 14: Mendel and the Gene Idea62 Questions
Exam 15: The Chromosomal Basis of Inheritance58 Questions
Exam 16: The Molecular Basis of Inheritance65 Questions
Exam 17: Gene Expression: From Gene to Protein67 Questions
Exam 18: Regulation of Gene Expression66 Questions
Exam 19: Viruses54 Questions
Exam 20: DNA Tools and Biotechnology57 Questions
Exam 21: Genomes and Their Evolution44 Questions
Exam 22: Descent with Modification: A Darwinian View of Life60 Questions
Exam 23: The Evolution of Populations64 Questions
Exam 24: The Origin of Species67 Questions
Exam 25: The History of Life on Earth59 Questions
Exam 26: Phylogeny and the Tree of Life75 Questions
Exam 27: Bacteria and Archaea75 Questions
Exam 28: Protists79 Questions
Exam 29: Plant Diversity I: How Plants Colonized Land82 Questions
Exam 30: Plant Diversity II: The Evolution of Seed Plants80 Questions
Exam 31: Fungi75 Questions
Exam 32: An Overview of Animal Diversity67 Questions
Exam 33: An Introduction to Invertebrates83 Questions
Exam 34: The Origin and Evolution of Vertebrates82 Questions
Exam 35: Vascular Plant Structure, Growth, and Development65 Questions
Exam 36: Resource Acquisition and Transport in Vascular Plants74 Questions
Exam 37: Soil and Plant Nutrition52 Questions
Exam 38: Angiosperm Reproduction and Biotechnology60 Questions
Exam 39: Plant Responses to Internal and External Signals61 Questions
Exam 40: Basic Principles of Animal Form and Function68 Questions
Exam 41: Animal Nutrition64 Questions
Exam 42: Circulation and Gas Exchange67 Questions
Exam 43: The Immune System69 Questions
Exam 44: Osmoregulation and Excretion64 Questions
Exam 45: Hormones and the Endocrine System66 Questions
Exam 46: Animal Reproduction68 Questions
Exam 47: Animal Development70 Questions
Exam 48: Neurons, Synapses, and Signaling68 Questions
Exam 49: Nervous Systems65 Questions
Exam 50: Sensory and Motor Mechanisms67 Questions
Exam 51: Animal Behavior69 Questions
Exam 52: An Introduction to Ecology and the Biosphere68 Questions
Exam 53: Population Ecology69 Questions
Exam 54: Community Ecology71 Questions
Exam 55: Ecosystems and Restoration Ecology68 Questions
Exam 56: Conservation Biology and Global Change69 Questions
Select questions type
Which of the following traits is characteristic of K-selected populations?
Free
(Multiple Choice)
5.0/5  (26)
(26)
Correct Answer: Verified
A
Which of the following is the best natural example of a uniform pattern of dispersion?
Free
(Multiple Choice)
4.8/5 (44)
Correct Answer:Verified
D
Use the figure to answer the following question.
Life Table for Zootoca vivipara in the Netherlands
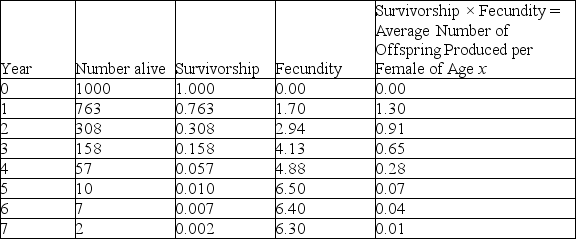 Data are from Strijbosch and Creemers, 1988.
Using the table, determine which age class year would cause the largest decline in the resulting population growth, if it were wiped out by disease.
Data are from Strijbosch and Creemers, 1988.
Using the table, determine which age class year would cause the largest decline in the resulting population growth, if it were wiped out by disease.
Free
(Multiple Choice)
4.9/5 (35)
Correct Answer:Verified
A
Use the figure to answer the following question.
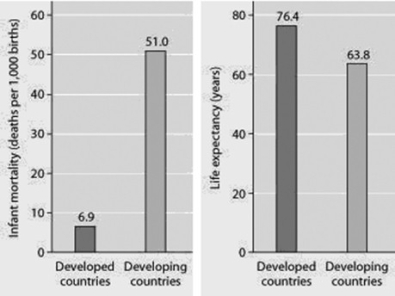 Infant mortality and life expectancy at birth in developed and developing countries (data as of 2005).
What is a logical conclusion that can be drawn from the graphs? Developed countries have ________.
Infant mortality and life expectancy at birth in developed and developing countries (data as of 2005).
What is a logical conclusion that can be drawn from the graphs? Developed countries have ________.
(Multiple Choice)
4.9/5 (32)
In which of the following situations would you expect to find the largest number of r-selected individuals?
(Multiple Choice)
4.9/5 (33)
Use the graph to answer the following question.
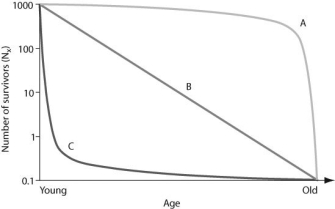 In the figure, which of the following survivorship curves most applies to humans living in developed countries?
(Multiple Choice)
4.9/5 (40)
Population ecologists follow the fate of same-age cohorts to
(Multiple Choice)
4.9/5 (33)
Imagine that you are managing a large game ranch. You know from historical accounts that a species of deer used to live there, but they have been extirpated. After doing some research to determine what might be an appropriately sized founding population, you reintroduce them. You then watch the population increase for several generations, and graph the number of individuals (vertical axis) against the number of generations (horizontal axis). With no natural predators impacting the population, the graph will likely appear as ________.
(Multiple Choice)
4.9/5 (33)
Which of the following graphs best illustrates the growth curve of a small population of rodents that has increased to a static carrying capacity?
(Multiple Choice)
4.7/5 (39)
Use the figure to answer the following question.
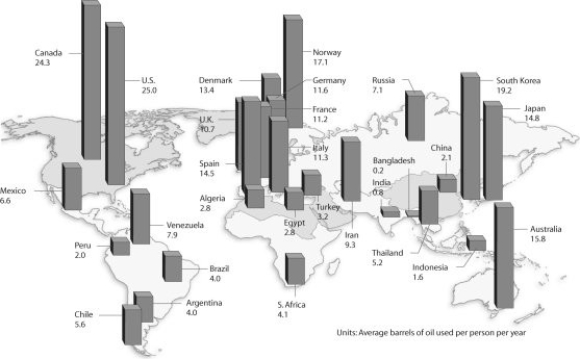 Based on the figure and given the populations of the following countries, which country uses the most oil overall?
(Multiple Choice)
4.8/5 (36)
Starting from a single individual, what is the size of a population of bacteria at the end of a 2-hour time period if they reproduce by binary fission every 20 minutes? (Assume unlimited resources and no mortality.)
(Multiple Choice)
4.9/5 (38)
Which of the following groups would be most likely to exhibit uniform dispersion?
(Multiple Choice)
4.8/5 (31)
Use the graphs to answer the following question.
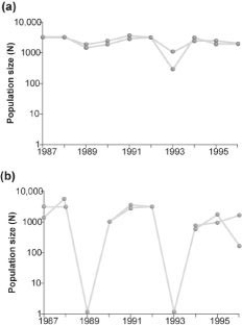 Graph (b) in the figure shows the normal fluctuations of a population of grouse, a ground-nesting bird. Assuming graph (a) in the figure is the result of some experimental treatment in the grouse population, what can be concluded?
(Multiple Choice)
4.8/5 (31)
Which statements about K are correct?
I. K varies among populations.
II. K varies in space.
III.K varies in time.
IV.K is constant for any given species.
(Multiple Choice)
4.8/5 (36)
Use the graph to answer the following question.
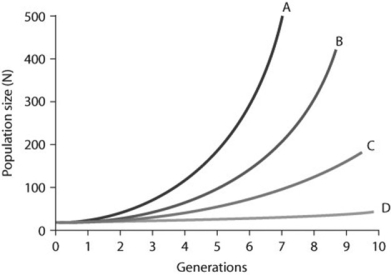 In the figure, curves A-D depict per capita rate increases (r). Which of the following best explains the difference between the shapes of these curves?
(Multiple Choice)
4.8/5 (35)
As N approaches K for a certain population, which of the following outcomes is predicted by the logistic equation?
(Multiple Choice)
4.8/5 (39)
Often the growth cycle of one population has an effect on the cycle of another. As moose populations increase, for example, wolf populations also increase. Thus, if we are considering the logistic equation for the wolf population, 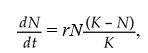 Which of the factors accounts for the effect of the moose population?
(Multiple Choice)
4.8/5 (32)
Filters
- Essay(0)
- Multiple Choice(0)
- Short Answer(0)
- True False(0)
- Matching(0)