Exam 3: Finding Relationships Among Variables
Exam 1: Introduction to Business Analytics29 Questions
Exam 2: Describing the Distribution of a Single Variable100 Questions
Exam 3: Finding Relationships Among Variables85 Questions
Exam 4: Probability and Probability Distributions114 Questions
Exam 5: Normal, Binomial, Poisson, and Exponential Distributions125 Questions
Exam 6: Decision Making Under Uncertainty107 Questions
Exam 7: Sampling and Sampling Distributions90 Questions
Exam 8: Confidence Interval Estimation84 Questions
Exam 9: Hypothesis Testing87 Questions
Exam 10: Regression Analysis: Estimating Relationships92 Questions
Exam 11: Regression Analysis: Statistical Inference82 Questions
Exam 12: Time Series Analysis and Forecasting106 Questions
Exam 13: Introduction to Optimization Modeling97 Questions
Exam 14: Optimization Models114 Questions
Exam 15: Introduction to Simulation Modeling82 Questions
Exam 16: Simulation Models102 Questions
Exam 17: Data Mining20 Questions
Exam 18: Importing Data Into Excel19 Questions
Exam 19: Analysis of Variance and Experimental Design20 Questions
Exam 20: Statistical Process Control20 Questions
Select questions type
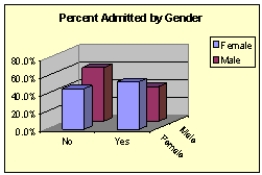
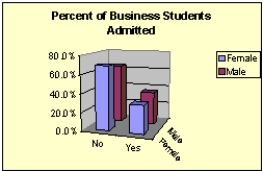
The students at a small community college in Iowa apply to study either English or Business. Some administrators at the college are concerned that women are being discriminated against in being allowed admittance, particularly in the business program. Below, you will find two pivot tables that show the percentage of students admitted by gender to the English program and the Business school. The data has also been presented graphically. What do the data and graphs indicate? 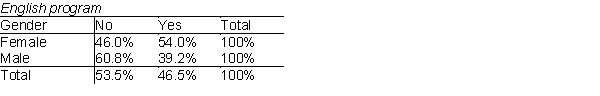
 Business school
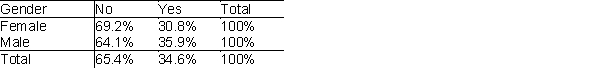
(Essay)
4.9/5  (27)
(27)
It is possible that the data points close to a curve have a correlation close to 0, because correlation is relevant only for measuring linear relationships.
(True/False)
4.8/5 (39)
Changing the location of fields in a pivot table is known as:
(Multiple Choice)
4.9/5 (33)
Approximate the percentage of these internet users who are women in the 30-43 age group.
(Short Answer)
4.9/5 (35)
What percentage of the students in the sample spent the weekend studying and did well in the final exam?
(Short Answer)
4.8/5 (44)
Relationships between two variables are less evident when counts are expressed as percentages of row totals or column totals.
(True/False)
4.9/5 (42)
Approximate the percentage of these Internet users who are married.
(Short Answer)
4.9/5 (33)
What percentage of the students in the sample went partying the weekend before the final exam and did well in the exam?
(Short Answer)
4.9/5 (34)
Comparing a numerical variable across two or more subpopulations is known as a comparison problem.
(True/False)
4.9/5 (30)
Counts for categorical variable are often expressed as percentages of the total.
(True/False)
4.9/5 (34)
Which correlation coefficient suggests the strongest relationship?
(Multiple Choice)
4.8/5 (34)
What percentage of the students in the sample went partying the weekend before the final exam and did poorly on the exam?
(Short Answer)
4.9/5 (42)
The following scatterplot compares the selling price and the appraised value. 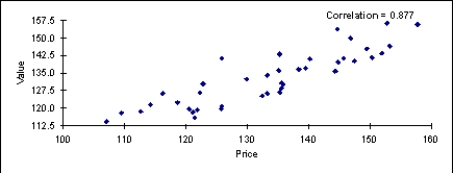 Is there a linear relationship between these two variables? If so, how would you characterize the relationship?
(Essay)
4.8/5 (37)
If the sample is a good representation of the population, what percentage of the students in the population should we expect to spend the weekend studying and do poorly on the final exam?
(Short Answer)
4.8/5 (35)
If the coefficient of correlation r = 0 .80, the standard deviations of X and Y are 20 and 25, respectively, then Cov(X, Y) must be 400.
(True/False)
4.7/5 (37)
Statisticians often refer to the pivot tables that display counts as contingency tables or crosstabs.
(True/False)
4.7/5 (35)
Filters
- Essay(0)
- Multiple Choice(0)
- Short Answer(0)
- True False(0)
- Matching(0)