Exam 3: Finding Relationships Among Variables
Exam 1: Introduction to Business Analytics29 Questions
Exam 2: Describing the Distribution of a Single Variable100 Questions
Exam 3: Finding Relationships Among Variables85 Questions
Exam 4: Probability and Probability Distributions114 Questions
Exam 5: Normal, Binomial, Poisson, and Exponential Distributions125 Questions
Exam 6: Decision Making Under Uncertainty107 Questions
Exam 7: Sampling and Sampling Distributions90 Questions
Exam 8: Confidence Interval Estimation84 Questions
Exam 9: Hypothesis Testing87 Questions
Exam 10: Regression Analysis: Estimating Relationships92 Questions
Exam 11: Regression Analysis: Statistical Inference82 Questions
Exam 12: Time Series Analysis and Forecasting106 Questions
Exam 13: Introduction to Optimization Modeling97 Questions
Exam 14: Optimization Models114 Questions
Exam 15: Introduction to Simulation Modeling82 Questions
Exam 16: Simulation Models102 Questions
Exam 17: Data Mining20 Questions
Exam 18: Importing Data Into Excel19 Questions
Exam 19: Analysis of Variance and Experimental Design20 Questions
Exam 20: Statistical Process Control20 Questions
Select questions type
An economic development researcher wants to understand the relationship between the average monthly expenditure on utilities for households in a particular middle-class neighborhood and each of the following household variables: family size, approximate location of the household within the neighborhood, and indication of whether those surveyed owned or rented their home, gross annual income of the first household wage earner, gross annual income of the second household wage earner (if applicable), size of the monthly home mortgage or rent payment, and the total indebtedness (excluding the value of a home mortgage) of the household.
The correlation for each pairing of variables are shown in the table below:
Table of correlations 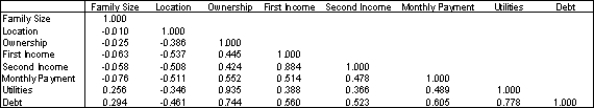 -Which of the variables have essentially no linear relationship with the household's average monthly expenditure on utilities?
(Essay)
4.9/5  (46)
(46)
Correlation and covariance can be used to examine relationships between numerical variables as well as for categorical variables that have been coded numerically.
(True/False)
4.8/5 (38)
We cannot attempt to interpret correlations numerically, with the one possible exception of indicating whether they are positive or negative.
(True/False)
4.8/5 (34)
An example of a joint category of two variables is the count of all non-drinkers who are also nonsmokers.
(True/False)
4.7/5 (43)
The tables of counts that result from pivot tables are often called:
(Multiple Choice)
4.9/5 (37)
If the standard deviation of X is 15, the covariance of X and Y is 94.5, and the correlation is 0.90, then the variance of Y is 7.0.
(True/False)
4.7/5 (44)
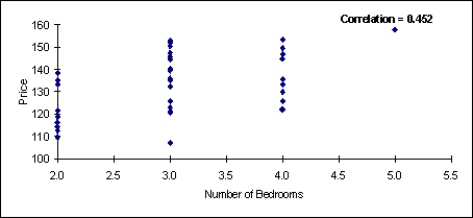
There are two scatterplots shown below. The first chart shows the relationship between the size of the home and the selling price. The second chart examines the relationship between the number of bedrooms in the home and its selling price. Which of these two variables (the size of the home or the number of bedrooms) seems to have the stronger relationship with the home's selling price? Justify your answer. 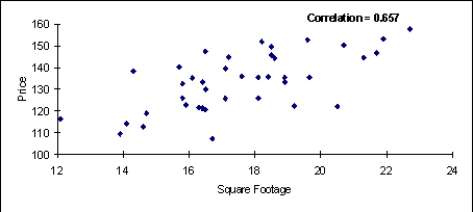
(Essay)
4.8/5 (36)
How would you characterize the relationship between gender and annual salary?
(Essay)
4.9/5 (26)
Suppose that a health magazine reports that a man's weight at birth has a significant impact on the chance that the man will suffer a heart attack during his life. A statistician analyzes a data set from a sample of 798 men, and produces the pivot table and histogram shown below. Determine how birth weight influences the chances that a man will have a heart attack. 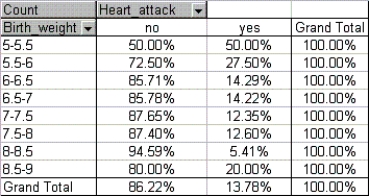
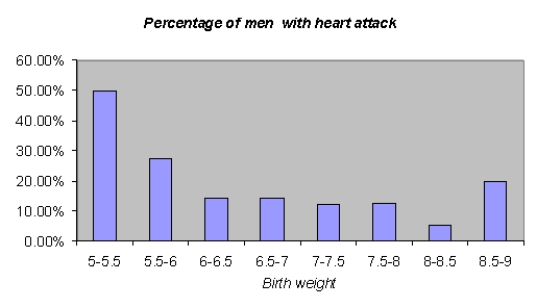
(Essay)
4.8/5 (30)
Strongly related variables may have a correlation close to zero if the relationship is nonlinear.
(True/False)
4.8/5 (36)
A line or curve superimposed on a scatterplot to quantify an apparent relationship is known as a(n):
(Multiple Choice)
4.7/5 (29)
A useful way of comparing the distribution of a numerical variable across categories of some categorical variable is with:
(Multiple Choice)
4.8/5 (37)
A data set from a sample of 399 Michigan families was collected. The data include family size (large or small), number of cars owned by family (1, 2, 3, or 4), and whether family owns a foreign car. Excel® produced the pivot table shown below. 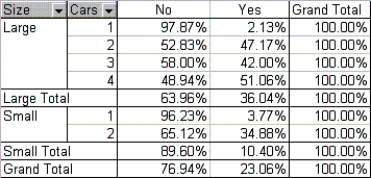 Use this pivot table to determine how family size and number of cars owned influence the likelihood that a family owns a foreign car.
(Essay)
4.8/5 (36)
Which of the following are considered numerical summary measures?
(Multiple Choice)
4.8/5 (41)
For which of the two variables, number of years of prior work experience or number of years of post-secondary education, is the relationship with salary stronger? Justify your answer.
(Essay)
4.9/5 (33)
To examine relationships between two categorical variables, we can use:
(Multiple Choice)
4.9/5 (31)
The tool that provides useful information about a data set by breaking it down into categories is the:
(Multiple Choice)
4.8/5 (46)
What percentage of these internet users has formal education beyond high school?
(Short Answer)
4.8/5 (38)
Approximate the percentage of these Internet users who are married with formal education beyond high school.
(Short Answer)
4.9/5 (44)
Filters
- Essay(0)
- Multiple Choice(0)
- Short Answer(0)
- True False(0)
- Matching(0)