Exam 3: Finding Relationships Among Variables
Exam 1: Introduction to Business Analytics29 Questions
Exam 2: Describing the Distribution of a Single Variable100 Questions
Exam 3: Finding Relationships Among Variables85 Questions
Exam 4: Probability and Probability Distributions114 Questions
Exam 5: Normal, Binomial, Poisson, and Exponential Distributions125 Questions
Exam 6: Decision Making Under Uncertainty107 Questions
Exam 7: Sampling and Sampling Distributions90 Questions
Exam 8: Confidence Interval Estimation84 Questions
Exam 9: Hypothesis Testing87 Questions
Exam 10: Regression Analysis: Estimating Relationships92 Questions
Exam 11: Regression Analysis: Statistical Inference82 Questions
Exam 12: Time Series Analysis and Forecasting106 Questions
Exam 13: Introduction to Optimization Modeling97 Questions
Exam 14: Optimization Models114 Questions
Exam 15: Introduction to Simulation Modeling82 Questions
Exam 16: Simulation Models102 Questions
Exam 17: Data Mining20 Questions
Exam 18: Importing Data Into Excel19 Questions
Exam 19: Analysis of Variance and Experimental Design20 Questions
Exam 20: Statistical Process Control20 Questions
Select questions type
A recent survey collected data from 1000 randomly selected Internet users. The characteristics of the users include their gender, age, education, marital status, and annual income. Using Excel®, the following pivot tables are produced.
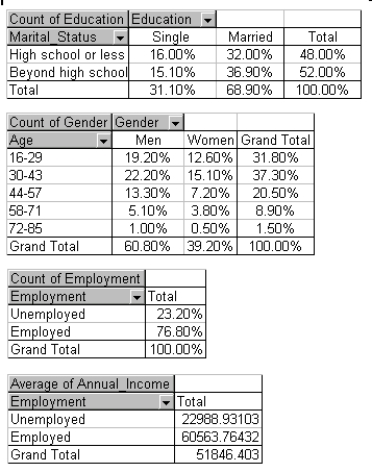 -Approximate the percentage of these Internet users who are men under the age of 30.
(Short Answer)
4.9/5  (37)
(37)
A sample of 150 students at a state university was taken after the final business statistics exam to ask them whether they went partying the weekend before the final or spent the weekend studying, and whether they did well or poorly on the final. The following table contains the result.  -Of those in the sample who went partying the weekend before the final exam, what percentage of them did well in the exam?
(Essay)
4.9/5 (39)
Economists believe that historically, countries with more income inequality have had lower unemployment rates. For example, an economist in 1996 developed the table below containing the following information for 10 countries during the 1980-1995 time period:
· The change from 1980 to 1995 in ratio of the average wage of the top 10% of all wage earners to the median wage
· The change from 1980 to 1995 in unemployment rate.
Income inequality vs. Unemployment rate 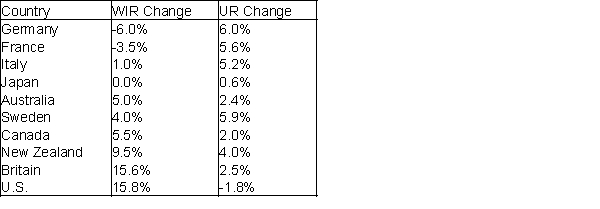 -Explain why the ratio of the average wage of the top 10% of all wage earners to the median measures income inequality.
(Essay)
4.7/5 (32)
Filters
- Essay(0)
- Multiple Choice(0)
- Short Answer(0)
- True False(0)
- Matching(0)