Exam 2: Describing the Distribution of a Single Variable
Exam 1: Introduction to Business Analytics29 Questions
Exam 2: Describing the Distribution of a Single Variable100 Questions
Exam 3: Finding Relationships Among Variables85 Questions
Exam 4: Probability and Probability Distributions114 Questions
Exam 5: Normal, Binomial, Poisson, and Exponential Distributions125 Questions
Exam 6: Decision Making Under Uncertainty107 Questions
Exam 7: Sampling and Sampling Distributions90 Questions
Exam 8: Confidence Interval Estimation84 Questions
Exam 9: Hypothesis Testing87 Questions
Exam 10: Regression Analysis: Estimating Relationships92 Questions
Exam 11: Regression Analysis: Statistical Inference82 Questions
Exam 12: Time Series Analysis and Forecasting106 Questions
Exam 13: Introduction to Optimization Modeling97 Questions
Exam 14: Optimization Models114 Questions
Exam 15: Introduction to Simulation Modeling82 Questions
Exam 16: Simulation Models102 Questions
Exam 17: Data Mining20 Questions
Exam 18: Importing Data Into Excel19 Questions
Exam 19: Analysis of Variance and Experimental Design20 Questions
Exam 20: Statistical Process Control20 Questions
Select questions type
Suppose that an analysis of a set of test scores reveals that: 
 , and
, and  -What can you say about the relative position of each of the observations 34, 84, and 104?
(Essay)
4.7/5  (34)
(34)
The data shown below contains family incomes (in thousands of dollars) for a set of 50 families sampled in 2007 and 2017. Assume that these families are good representatives of the entire United States. 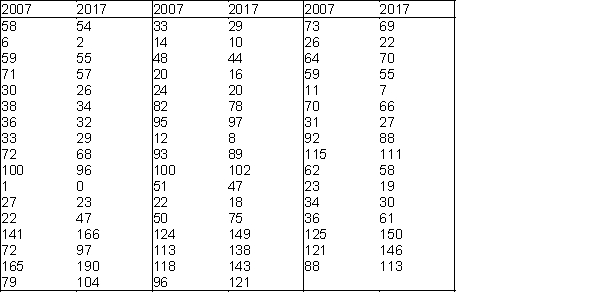
-Find the mean, median, standard deviation, first and third quartiles, and the 95th percentile for family incomes in both years.
-Find the mean, median, standard deviation, first and third quartiles, and the 95th percentile for family incomes in both years.
(Essay)
4.7/5 (38)
The number of car insurance policy holders is an example of a discrete numerical variable.
(True/False)
4.8/5 (38)
The interquartile range (IQR) encompasses what percent of the observations?
(Multiple Choice)
4.7/5 (39)
A distribution with a high kurtosis has almost all of its observations within three standard deviations of the mean.
(True/False)
4.9/5 (44)
A frequency table indicates how many observations fall within each category, and a histogram is its graphical analog.
(True/False)
4.9/5 (36)
Data that arise from counts are best described as _____ data.
(Multiple Choice)
4.9/5 (31)
There are four quartiles that divide the values in a data set into four equal parts.
(True/False)
4.8/5 (32)
What measure of distribution relates to extreme events, such as a stock market crash?
(Multiple Choice)
4.8/5 (37)
As a graphical tool, the histogram is ideal for showing whether the distribution of a numerical variable is symmetric or skewed.
(True/False)
4.7/5 (34)
A think tank of economists is interested in how the distribution of family income has changed in Country X during the last 20 years. The summary measures and histograms shown below are generated for a sample of 500 family incomes, using the 1997 and 2017 income for each family in the sample.
Summary Measures (in thousands of dollars): 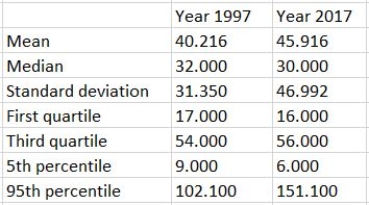
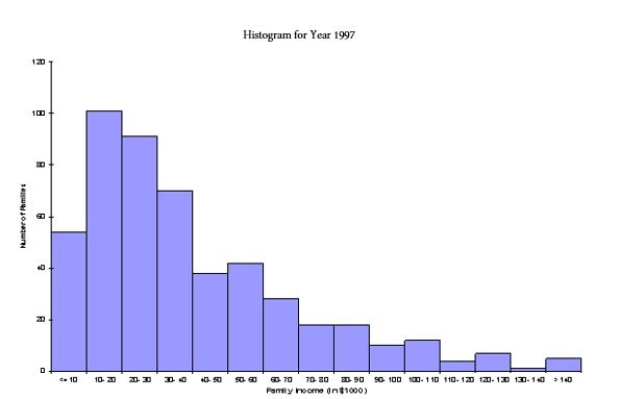
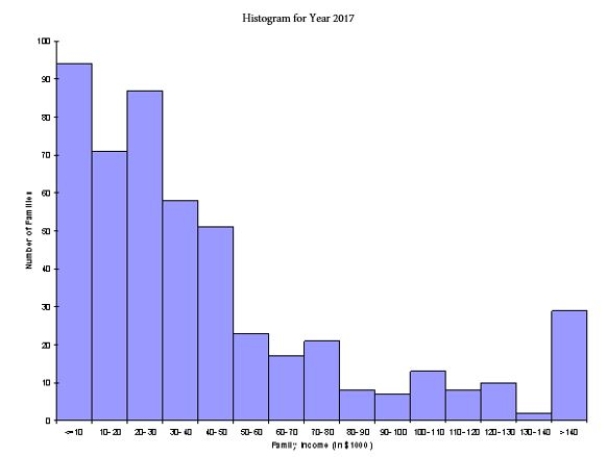 Based on these results, discuss as completely as possible how the distribution of family income in Country X changed from 1997 to 2017.
(Essay)
4.9/5 (36)
The median of a data set with 30 values would be the average of the 15th and the 16th values when the data values are arranged in ascending order.
(True/False)
4.8/5 (40)
In order for the characteristics of a sample to be generalized to the entire population, the sample should be:
(Multiple Choice)
4.8/5 (33)
Based on the histogram shown below, how would you describe the age distribution for these data? 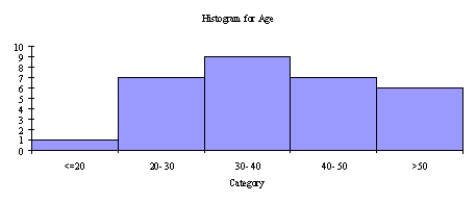
(Essay)
4.8/5 (37)
Filters
- Essay(0)
- Multiple Choice(0)
- Short Answer(0)
- True False(0)
- Matching(0)