Exam 2: Describing the Distribution of a Single Variable
Exam 1: Introduction to Business Analytics29 Questions
Exam 2: Describing the Distribution of a Single Variable100 Questions
Exam 3: Finding Relationships Among Variables85 Questions
Exam 4: Probability and Probability Distributions114 Questions
Exam 5: Normal, Binomial, Poisson, and Exponential Distributions125 Questions
Exam 6: Decision Making Under Uncertainty107 Questions
Exam 7: Sampling and Sampling Distributions90 Questions
Exam 8: Confidence Interval Estimation84 Questions
Exam 9: Hypothesis Testing87 Questions
Exam 10: Regression Analysis: Estimating Relationships92 Questions
Exam 11: Regression Analysis: Statistical Inference82 Questions
Exam 12: Time Series Analysis and Forecasting106 Questions
Exam 13: Introduction to Optimization Modeling97 Questions
Exam 14: Optimization Models114 Questions
Exam 15: Introduction to Simulation Modeling82 Questions
Exam 16: Simulation Models102 Questions
Exam 17: Data Mining20 Questions
Exam 18: Importing Data Into Excel19 Questions
Exam 19: Analysis of Variance and Experimental Design20 Questions
Exam 20: Statistical Process Control20 Questions
Select questions type
Generate a box plot to summarize the data. What does the box plot indicate?
(Essay)
4.9/5  (35)
(35)
A data set is typically a rectangular array of data, with observations in columns and variables in rows.
(True/False)
4.7/5 (30)
The difference between the largest and smallest values in a data set is called the range.
(True/False)
4.9/5 (41)
In a generic box plot, the vertical line inside the box indicates the location of the:
(Multiple Choice)
4.9/5 (39)
With symmetric, "bell-shaped" distributions, approximately what percent of the observations are within two standard deviations of the mean?
(Multiple Choice)
4.8/5 (32)
Indicate the type of data for each of the six variables included in this set.
(Essay)
4.9/5 (30)
A variable (or field or attribute) is a characteristic of members of a population, whereas an observation (or case or record) is a list of all variable values for a single member of a population.
(True/False)
4.9/5 (37)
A sample of 8 observations with a standard deviation of 2.50 has a sum of the squared deviations from the sample mean equal to 17.50.
(True/False)
4.9/5 (37)
The data below represents monthly sales for two years of beanbag animals at a local retail store (Month 1 represents January and Month 12 represents December). Given the time series plot below, do you see any obvious patterns in the data? Explain. 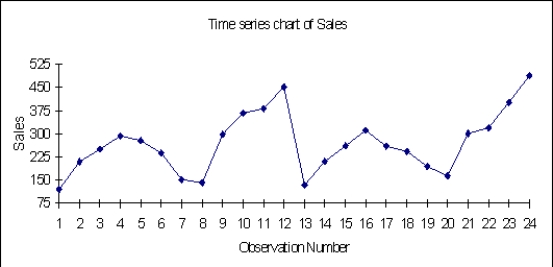
(Essay)
4.9/5 (22)
If the mean is 75 and two observations have values of 65 and 85, what is the squared deviation of each?
(Multiple Choice)
4.8/5 (32)
The average score for a class of 30 students was 75. The 20 male students in the class averaged 70. The 10 female students in the class averaged:
(Multiple Choice)
4.8/5 (32)
A histogram is based on binning the variable, which means putting the variable into discrete categories.
(True/False)
4.7/5 (36)
The daily closing values of the Dow Jones Industrial Average over a period of 30 days are best described as _____ data.
(Multiple Choice)
4.9/5 (44)
Mean absolute deviation (MAD) is the average of the squared deviations.
(True/False)
4.8/5 (42)
Based on the histogram shown below, how would you describe the salary distribution for these data? 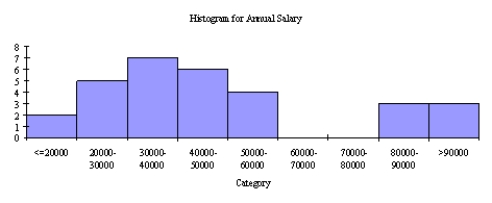
(Essay)
4.9/5 (36)
What are the three most common measures of central tendency?
(Multiple Choice)
4.9/5 (30)
If a value represents the 95th percentile, this means that:
(Multiple Choice)
4.9/5 (33)
Filters
- Essay(0)
- Multiple Choice(0)
- Short Answer(0)
- True False(0)
- Matching(0)