Exam 2: Describing the Distribution of a Single Variable
Exam 1: Introduction to Business Analytics29 Questions
Exam 2: Describing the Distribution of a Single Variable100 Questions
Exam 3: Finding Relationships Among Variables85 Questions
Exam 4: Probability and Probability Distributions114 Questions
Exam 5: Normal, Binomial, Poisson, and Exponential Distributions125 Questions
Exam 6: Decision Making Under Uncertainty107 Questions
Exam 7: Sampling and Sampling Distributions90 Questions
Exam 8: Confidence Interval Estimation84 Questions
Exam 9: Hypothesis Testing87 Questions
Exam 10: Regression Analysis: Estimating Relationships92 Questions
Exam 11: Regression Analysis: Statistical Inference82 Questions
Exam 12: Time Series Analysis and Forecasting106 Questions
Exam 13: Introduction to Optimization Modeling97 Questions
Exam 14: Optimization Models114 Questions
Exam 15: Introduction to Simulation Modeling82 Questions
Exam 16: Simulation Models102 Questions
Exam 17: Data Mining20 Questions
Exam 18: Importing Data Into Excel19 Questions
Exam 19: Analysis of Variance and Experimental Design20 Questions
Exam 20: Statistical Process Control20 Questions
Select questions type
Seventy percent of the job applicants scored above what value?
(Short Answer)
4.8/5  (38)
(38)
A sample of a population taken at one particular point in time is categorized as:
(Multiple Choice)
4.8/5 (32)
Because they represent such extreme values, outliers should be eliminated from statistical analyses.
(True/False)
4.8/5 (30)
Suppose that a sample of 10 observations has a standard deviation of 3. Then the sum of the squared deviations from the sample mean is 30.
(True/False)
4.7/5 (38)
Phone numbers, Social Security numbers, and zip codes are typically treated as numerical variables.
(True/False)
4.8/5 (30)
Is the distribution of the number of children symmetrical or skewed? How do you know?
(Essay)
4.9/5 (29)
Which statement is true for the following data values: 7, 5, 6, 4, 7, 8, and 12?
(Multiple Choice)
4.9/5 (29)
Cross-sectional data are data on a population at a distinct point in time, whereas time series data are data collected over time.
(True/False)
4.9/5 (36)
Categorizing age variables as "young," "middle-aged," and "elderly" is an example of:
(Multiple Choice)
4.8/5 (33)
Are the empirical rules applicable in this case? If so, apply them and interpret your results. If not, explain why the empirical rules are not applicable here.
(Essay)
4.8/5 (37)
Unlike histograms, box plots depict only one aspect of a variable.
(True/False)
4.9/5 (42)
A sample of 20 observations has a standard deviation of 4. The sum of the squared deviations from the sample mean is:
(Multiple Choice)
4.8/5 (28)
What is the most common type of chart for showing the distribution of a numerical variable?
(Multiple Choice)
4.8/5 (41)
Researchers are conducting a review of the "war against poverty" in the latter half of the twentieth century. As part of their analysis, the proportion of Americans under the age of 18 who lived below the poverty line for each of the years 1959 through 2000 is used to generate the following time series plot.
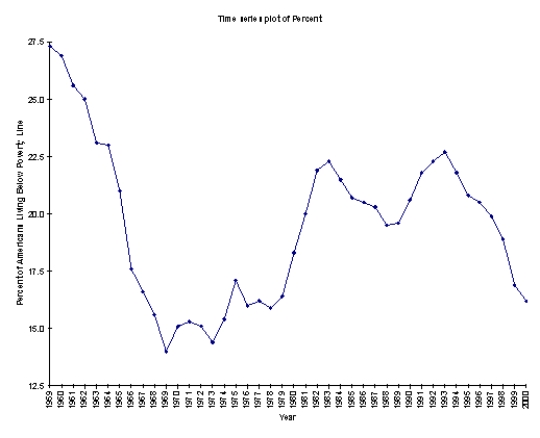 How successful was the United States in its efforts to win "the war against poverty" for the nation's children during this time period?
(Essay)
4.9/5 (32)
Statistics professor has just given a final examination in his statistical inference course. He is particularly interested in learning how his class of 40 students performed on this exam. The scores are shown below.  -What are the mean and median scores on this exam?
(Essay)
4.9/5 (36)
The value of the mean times the number of observations equals the sum of all of the data values.
(True/False)
4.8/5 (35)
The core purpose of time series graphs is to detect historical patterns in the data.
(True/False)
4.7/5 (32)
A population includes all elements or objects of interest in a study, whereas a sample is a subset of the population used to gain insights into the characteristics of the population.
(True/False)
4.9/5 (34)
Filters
- Essay(0)
- Multiple Choice(0)
- Short Answer(0)
- True False(0)
- Matching(0)