Exam 2: Describing the Distribution of a Single Variable
Exam 1: Introduction to Business Analytics29 Questions
Exam 2: Describing the Distribution of a Single Variable100 Questions
Exam 3: Finding Relationships Among Variables85 Questions
Exam 4: Probability and Probability Distributions114 Questions
Exam 5: Normal, Binomial, Poisson, and Exponential Distributions125 Questions
Exam 6: Decision Making Under Uncertainty107 Questions
Exam 7: Sampling and Sampling Distributions90 Questions
Exam 8: Confidence Interval Estimation84 Questions
Exam 9: Hypothesis Testing87 Questions
Exam 10: Regression Analysis: Estimating Relationships92 Questions
Exam 11: Regression Analysis: Statistical Inference82 Questions
Exam 12: Time Series Analysis and Forecasting106 Questions
Exam 13: Introduction to Optimization Modeling97 Questions
Exam 14: Optimization Models114 Questions
Exam 15: Introduction to Simulation Modeling82 Questions
Exam 16: Simulation Models102 Questions
Exam 17: Data Mining20 Questions
Exam 18: Importing Data Into Excel19 Questions
Exam 19: Analysis of Variance and Experimental Design20 Questions
Exam 20: Statistical Process Control20 Questions
Select questions type
An operations management professor is interested in how her students performed on her midterm exam. The histogram shown below represents the distribution of exam scores (where the maximum score is 100) for 50 students. 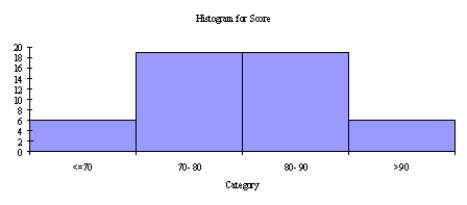 Based on this histogram, how would you characterize the students' performance on this exam?
(Essay)
4.8/5  (41)
(41)
A political figure running for re-election claimed that the country was better off in 2017 than in 2007, because the average income increased. Do you agree?
(Essay)
4.9/5 (29)
In an extremely right-skewed distribution, the mean is much smaller than the median.
(True/False)
4.9/5 (37)
How would you describe the salary of Virginia's teachers compared to those across the entire United States? Justify your answer.
(Essay)
4.9/5 (40)
As a measure of variability, what is defined as the maximum value minus the minimum value?
(Multiple Choice)
4.8/5 (23)
The histogram below represents scores achieved by 250 job applicants on a personality profile. 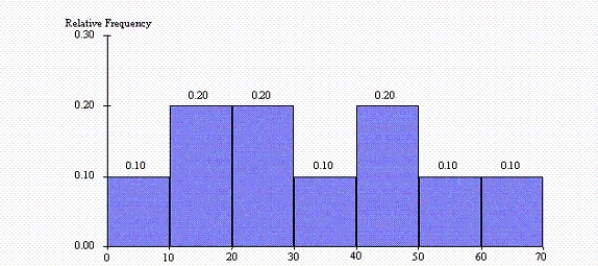 -What percentage of the job applicants scored between 30 and 40?
(Short Answer)
4.9/5 (28)
The median is one of the most frequently used measures of variability.
(True/False)
4.8/5 (30)
Calculate the interquartile range. What does this tell you about the data?
(Essay)
4.7/5 (36)
In the term "frequency table," frequency refers to the counts of observations in specified categories.
(True/False)
4.8/5 (25)
Statistics professor has just given a final examination in his statistical inference course. He is particularly interested in learning how his class of 40 students performed on this exam. The scores are shown below.  -Explain why the mean and median are different.
(Essay)
4.7/5 (31)
Expressed in percentiles, the interquartile range is the difference between the:
(Multiple Choice)
4.7/5 (37)
The histogram below represents scores achieved by 250 job applicants on a personality profile.
-What percentage of the job applicants scored below 60?
(Short Answer)
4.7/5 (38)
Abby has been keeping track of what she spends to stream movies. The last seven week's expenditures, in dollars, were 6, 4, 8, 9, 6, 12, and 4. The mean amount Abby spends on streaming movies is $7.
(True/False)
4.8/5 (30)
How is the median defined if the number of observations is even?
(Multiple Choice)
4.9/5 (40)
Researchers may try to gain insight into the characteristics of a population by examining a(n) _____ of the population.
(Multiple Choice)
4.9/5 (38)
Categorical variables can be classified as either discrete or continuous.
(True/False)
5.0/5 (36)
Filters
- Essay(0)
- Multiple Choice(0)
- Short Answer(0)
- True False(0)
- Matching(0)