Exam 12: Time Series Analysis and Forecasting
Exam 1: Introduction to Business Analytics29 Questions
Exam 2: Describing the Distribution of a Single Variable100 Questions
Exam 3: Finding Relationships Among Variables85 Questions
Exam 4: Probability and Probability Distributions114 Questions
Exam 5: Normal, Binomial, Poisson, and Exponential Distributions125 Questions
Exam 6: Decision Making Under Uncertainty107 Questions
Exam 7: Sampling and Sampling Distributions90 Questions
Exam 8: Confidence Interval Estimation84 Questions
Exam 9: Hypothesis Testing87 Questions
Exam 10: Regression Analysis: Estimating Relationships92 Questions
Exam 11: Regression Analysis: Statistical Inference82 Questions
Exam 12: Time Series Analysis and Forecasting106 Questions
Exam 13: Introduction to Optimization Modeling97 Questions
Exam 14: Optimization Models114 Questions
Exam 15: Introduction to Simulation Modeling82 Questions
Exam 16: Simulation Models102 Questions
Exam 17: Data Mining20 Questions
Exam 18: Importing Data Into Excel19 Questions
Exam 19: Analysis of Variance and Experimental Design20 Questions
Exam 20: Statistical Process Control20 Questions
Select questions type
The Consumer Confidence Index (CCI) attempts to measure people's feelings about general business conditions, employment opportunities, and their own income prospects. Analysts are compiling a summary of CCIs over the past decade (2007-2017), and before doing so, would like to review data prior to 2007. The data shown below contains the annual average values of the CCI for the period 1977-2006. 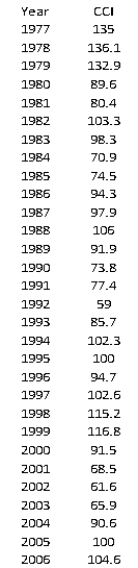 -Obtain an autocorrelation table for this series.
(Essay)
4.7/5  (33)
(33)
The linear trend  was estimated using a time series with 20 time periods. The forecasted value for time period 21 is:
(Multiple Choice)
4.9/5 (28)
An exponential trend is appropriate when the time series changes by a constant percentage each period.
(True/False)
4.9/5 (29)
The purpose of using the moving average is to take away the short-term seasonal and random variation, leaving behind a combined trend and cyclical movement.
(True/False)
4.8/5 (33)
The null hypothesis in a runs test is  the data series is random.
(True/False)
5.0/5 (30)
Run the moving average fit again, this time holding out the last 6 observations to validate the fit. What do you find?
(Essay)
4.9/5 (37)
The most common form of autocorrelation is positive autocorrelation, where large observations tend to follow large observations and small observations tend to follow small observations.
(True/False)
4.8/5 (38)
A regression approach can also be used to deal with seasonality by using ____ variables for the seasons.
(Multiple Choice)
4.9/5 (39)
Regression models with seasonal dummy variables produce coefficients for each quarter, which represent the additive or multiplicative factors relative to the annual average.
(True/False)
4.8/5 (32)
When using exponential smoothing, a smoothing constant  must be used. The value for
  :
:
(Multiple Choice)
4.8/5 (37)
In a random walk model, there are significantly more runs than expected, and the autocorrelations are not significant.
(True/False)
4.8/5 (37)
Seasonal variations will not be present in a deseasonalized time series.
(True/False)
4.8/5 (33)
If a time series exhibits an exponential trend, then a plot of its logarithm should be approximately linear.
(True/False)
4.9/5 (30)
An online travel agency is performing market analysis to determine how their sales have impacted brick-and-mortar travel agencies in key cities since its launch ten years ago. The table below contains the monthly number of airline tickets sold by a local travel agency in Grand Rapids, Michigan during the first four years of the online travel agency's business. 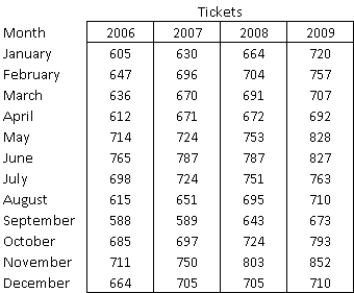 -(A) Is this time series random? Perform a runs test and compute a few autocorrelations to support your answer.
(B) Does a linear trend appear to fit these data well? If so, estimate the linear-trend model for this time series, and interpret the
-(A) Is this time series random? Perform a runs test and compute a few autocorrelations to support your answer.
(B) Does a linear trend appear to fit these data well? If so, estimate the linear-trend model for this time series, and interpret the  value.
(C) Is there evidence of some seasonal pattern in these sales data? If so, characterize the seasonal pattern, and explain how to forecast future values.
value.
(C) Is there evidence of some seasonal pattern in these sales data? If so, characterize the seasonal pattern, and explain how to forecast future values.
(Essay)
4.8/5 (30)
To deseasonalize an observation (assuming a multiplicative model of seasonality), multiply it by the appropriate seasonal index.
(True/False)
4.8/5 (31)
In a random series, successive observations are probabilistically independent of one another. If this property is violated, the observations are said to be:
(Multiple Choice)
4.8/5 (36)
We compute the five-period moving averages for all time periods except the first two.
(True/False)
4.8/5 (39)
A shortcoming of the RMSE (root mean square error) is that it is not in the same units as the forecast variable.
(True/False)
4.9/5 (40)
If we use a value close to 1 for the level smoothing constant  and a value close to 0 for the trend smoothing constant
  in Holt's exponential smoothing model, then we expect the model to respond very quickly to changes in the level, but very slowly to changes in the trend.
(True/False)
4.8/5 (33)
The number of reported accidents at a manufacturing plant located in Flint, Michigan, is recorded at the start of each month. State investigators are responding to a recent complaint by reviewing data from past complaints over sets of three years at a time. The data from 2006-2008 are provided in the table below: 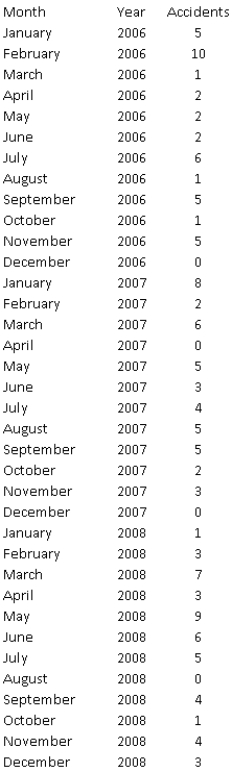 Is this time series random? Perform a runs test and compute a few autocorrelations to support your answer.
(Essay)
4.9/5 (37)
Filters
- Essay(0)
- Multiple Choice(0)
- Short Answer(0)
- True False(0)
- Matching(0)