Exam 12: Time Series Analysis and Forecasting
Exam 1: Introduction to Business Analytics29 Questions
Exam 2: Describing the Distribution of a Single Variable100 Questions
Exam 3: Finding Relationships Among Variables85 Questions
Exam 4: Probability and Probability Distributions114 Questions
Exam 5: Normal, Binomial, Poisson, and Exponential Distributions125 Questions
Exam 6: Decision Making Under Uncertainty107 Questions
Exam 7: Sampling and Sampling Distributions90 Questions
Exam 8: Confidence Interval Estimation84 Questions
Exam 9: Hypothesis Testing87 Questions
Exam 10: Regression Analysis: Estimating Relationships92 Questions
Exam 11: Regression Analysis: Statistical Inference82 Questions
Exam 12: Time Series Analysis and Forecasting106 Questions
Exam 13: Introduction to Optimization Modeling97 Questions
Exam 14: Optimization Models114 Questions
Exam 15: Introduction to Simulation Modeling82 Questions
Exam 16: Simulation Models102 Questions
Exam 17: Data Mining20 Questions
Exam 18: Importing Data Into Excel19 Questions
Exam 19: Analysis of Variance and Experimental Design20 Questions
Exam 20: Statistical Process Control20 Questions
Select questions type
We compare the percent of variation explained R2 for a regression model with seasonal dummy variables to the MAPE for the smoothing model with seasonality to see which model is more accurate.
(True/False)
4.8/5  (29)
(29)
Rite Aid pharmacy in Big Rapids, Michigan is using simple exponential smoothing to predict monthly birthday card sales. At the end of October 2015, the pharmacy's forecast for December 2015 sales was 400. In November, 420 cards were sold, and during December, 425 cards were sold. At the end of December 2015, what is the pharmacy's forecast for the total number of cards that will be sold during March and April of 2016? Use  .
.
(Essay)
4.8/5 (40)
Which summary measure for forecast errors does not depend on the units of the forecast variable?
(Multiple Choice)
4.8/5 (37)
You will always get more accurate forecasts by using more complex forecasting methods.
(True/False)
4.9/5 (37)
A moving average is the average of the observations in the past few periods, where the number of terms in the average is the span.
(True/False)
4.8/5 (29)
An autocorrelation is a type of correlation used to measure whether the values of a time series are related to their own past values.
(True/False)
4.9/5 (34)
Econometric forecasting models, also called causal models, use regression to forecast a time series variable by using other explanatory time series variables.
(True/False)
4.9/5 (36)
The smoothing constants in exponential smoothing models are effectively a way to assign different weights to past levels, trends and cycles in the data.
(True/False)
4.8/5 (34)
Every form of exponential smoothing model has at least one smoothing constant, which is always between 0 and 1.
(True/False)
4.9/5 (33)
In an additive seasonal model, we add an appropriate seasonal index to a "base" forecast. These indexes, one for each season, typically average to 0.
(True/False)
4.9/5 (40)
If we use a value close to 1 for the smoothing constant  in a simple exponential smoothing model, then we expect the model to respond very slowly to changes in the level.
(True/False)
4.8/5 (38)
When using Holt's model, choosing values of the smoothing constant  that are near 1 will result in forecast models that:
(Multiple Choice)
4.8/5 (35)
The time series component that reflects a long-term, relatively smooth pattern or direction exhibited by a time series over a long time period, is called seasonal.
(True/False)
4.7/5 (42)
Consider a random walk model with the following equation: 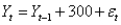 , where
  is a normally distributed random series with mean of 0 and standard deviation of 12.
-(A) Use Excel to generate a time series of 25 values using this random walk model with a starting value of 200.
(B) Conduct a runs test on the series you generated for (A). Is it random? Explain.
(C) Conduct a runs test on the differences between successive values for the series you generated for (A). Is it random? Explain.
(D) Use the time series you constructed in (A) to forecast the next observation.
is a normally distributed random series with mean of 0 and standard deviation of 12.
-(A) Use Excel to generate a time series of 25 values using this random walk model with a starting value of 200.
(B) Conduct a runs test on the series you generated for (A). Is it random? Explain.
(C) Conduct a runs test on the differences between successive values for the series you generated for (A). Is it random? Explain.
(D) Use the time series you constructed in (A) to forecast the next observation.
(Essay)
4.8/5 (36)
The data below represents sales for a particular product. If you were to use the moving average method with a span of 3 periods, what would be your forecast for period 5? 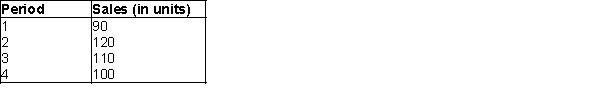
(Multiple Choice)
4.8/5 (41)
A time series is any variable that is measured over time in sequential order.
(True/False)
4.8/5 (40)
Suppose that a simple exponential smoothing model is used (with  = 0.40) to forecast monthly sandwich sales at a local sandwich shop. The forecasted demand for September was 1560 and the actual demand was 1480 sandwiches. Given this information, what would be the forecast number of sandwiches for October?
(Multiple Choice)
4.9/5 (32)
Filters
- Essay(0)
- Multiple Choice(0)
- Short Answer(0)
- True False(0)
- Matching(0)