Exam 12: Time Series Analysis and Forecasting
Exam 1: Introduction to Business Analytics29 Questions
Exam 2: Describing the Distribution of a Single Variable100 Questions
Exam 3: Finding Relationships Among Variables85 Questions
Exam 4: Probability and Probability Distributions114 Questions
Exam 5: Normal, Binomial, Poisson, and Exponential Distributions125 Questions
Exam 6: Decision Making Under Uncertainty107 Questions
Exam 7: Sampling and Sampling Distributions90 Questions
Exam 8: Confidence Interval Estimation84 Questions
Exam 9: Hypothesis Testing87 Questions
Exam 10: Regression Analysis: Estimating Relationships92 Questions
Exam 11: Regression Analysis: Statistical Inference82 Questions
Exam 12: Time Series Analysis and Forecasting106 Questions
Exam 13: Introduction to Optimization Modeling97 Questions
Exam 14: Optimization Models114 Questions
Exam 15: Introduction to Simulation Modeling82 Questions
Exam 16: Simulation Models102 Questions
Exam 17: Data Mining20 Questions
Exam 18: Importing Data Into Excel19 Questions
Exam 19: Analysis of Variance and Experimental Design20 Questions
Exam 20: Statistical Process Control20 Questions
Select questions type
Assume that the trend line 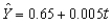 was calculated from quarterly data for 2011 - 2015, where t = 1 for the first quarter of 2011. The trend value for the second quarter of the year 2016 is 0.75.
(True/False)
4.8/5  (37)
(37)
Forecasting software packages typically report several summary measures of the forecasting error. The most important of these are MAE (mean absolute error), RMSE (root mean square error), and MAPE (mean absolute percentage error).
(True/False)
4.8/5 (38)
A car dealer in Big Rapids, Michigan is using Holt's method to forecast weekly car sales. Currently the level is estimated to be 45 cars per week, and the trend is estimated to be 5 cars per week. During the current week, 25 cars are sold. After observing the current week's sales, forecast the number of cars three weeks from now. Use  .
.
(Essay)
4.9/5 (31)
An equation for the random walk model is given by the equation:  , where
  is the change in the time series from time t to time t - 1,
  is a constant, and
  is a random variable (noise) with mean 0 and some standard deviation
  .
.
(True/False)
5.0/5 (45)
The data below represents sales for a particular product. If you were to use the moving average method with a span of 4 periods, what would be your forecast for period 5? 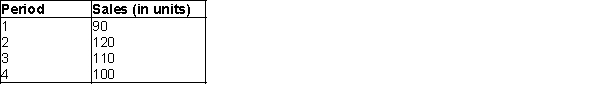
(Multiple Choice)
4.9/5 (47)
Simple exponential smoothing is appropriate for a series without a pronounced trend or seasonality.
(True/False)
4.8/5 (38)
Winters' model differs from Holt's model and simple exponential smoothing in that it includes an index for:
(Multiple Choice)
4.7/5 (40)
The following are the values of a time series for the first four time periods:  Using a four-period moving average, the forecasted value for time period 5 is:
(Multiple Choice)
4.8/5 (37)
If the span of a moving average is large - say, 12 months - then few observations go into each average, and extreme values have relatively large effect on the forecasts.
(True/False)
5.0/5 (25)
The smoothing constant used in simple exponential smoothing is analogous to the span in moving averages.
(True/False)
4.8/5 (32)
Use the method of moving average with an appropriate span to forecast retail sales for the first half of 2009. Do you obtain a good fit? Do you have confidence in your forecast? Explain your answers.
(Essay)
4.9/5 (39)
Models such as moving averages, exponential smoothing, and linear trend use only:
(Multiple Choice)
4.9/5 (44)
Correlogram is a bar chart of autocorrelation at different lags.
(True/False)
4.8/5 (34)
Suppose that simple exponential smoothing with  is used to forecast monthly wine sales at a liquor store. After April's demand is observed, the forecasted demand for May is 4500 bottles of wine.
-(A) At the beginning of May, what is the forecast of July's wine sales?
(B) Suppose that actual demands during May and June are as follows: May, 5000 bottle of wine; June 4000 bottle of wine. After observing June's demand, what is the forecast for July's demand?
(C) Based on the data from (B), the demands during May and June average (5000+4000)/2 = 4500 bottle per month. This is the same as the forecast for monthly sales before we observed the May and June data. Yet after we observe the May and June demands for wine, our forecast for July demand has decreased from what it was at the end of April. Why?
is used to forecast monthly wine sales at a liquor store. After April's demand is observed, the forecasted demand for May is 4500 bottles of wine.
-(A) At the beginning of May, what is the forecast of July's wine sales?
(B) Suppose that actual demands during May and June are as follows: May, 5000 bottle of wine; June 4000 bottle of wine. After observing June's demand, what is the forecast for July's demand?
(C) Based on the data from (B), the demands during May and June average (5000+4000)/2 = 4500 bottle per month. This is the same as the forecast for monthly sales before we observed the May and June data. Yet after we observe the May and June demands for wine, our forecast for July demand has decreased from what it was at the end of April. Why?
(Essay)
4.9/5 (28)
The time series component that reflects a wavelike pattern describing a long-term trend that is generally apparent over a number of years is called cyclical.
(True/False)
4.8/5 (32)
When using exponential smoothing, if you want the forecast to react quickly to movements in the series, you should choose:
(Multiple Choice)
4.9/5 (38)
Which term refers to a consecutive series of observations that remain on one side of the base level?
(Multiple Choice)
4.8/5 (30)
Holt's method is an exponential smoothing method, which is appropriate for a series with seasonality and possibly a trend.
(True/False)
4.9/5 (32)
Perhaps the simplest and one of the most frequently used extrapolation methods is the:
(Multiple Choice)
5.0/5 (35)
Filters
- Essay(0)
- Multiple Choice(0)
- Short Answer(0)
- True False(0)
- Matching(0)