Exam 10: Regression Analysis: Estimating Relationships
Exam 1: Introduction to Business Analytics29 Questions
Exam 2: Describing the Distribution of a Single Variable100 Questions
Exam 3: Finding Relationships Among Variables85 Questions
Exam 4: Probability and Probability Distributions114 Questions
Exam 5: Normal, Binomial, Poisson, and Exponential Distributions125 Questions
Exam 6: Decision Making Under Uncertainty107 Questions
Exam 7: Sampling and Sampling Distributions90 Questions
Exam 8: Confidence Interval Estimation84 Questions
Exam 9: Hypothesis Testing87 Questions
Exam 10: Regression Analysis: Estimating Relationships92 Questions
Exam 11: Regression Analysis: Statistical Inference82 Questions
Exam 12: Time Series Analysis and Forecasting106 Questions
Exam 13: Introduction to Optimization Modeling97 Questions
Exam 14: Optimization Models114 Questions
Exam 15: Introduction to Simulation Modeling82 Questions
Exam 16: Simulation Models102 Questions
Exam 17: Data Mining20 Questions
Exam 18: Importing Data Into Excel19 Questions
Exam 19: Analysis of Variance and Experimental Design20 Questions
Exam 20: Statistical Process Control20 Questions
Select questions type
A constant elasticity, or multiplicative, model the dependent variable is expressed as a product of explanatory variables raised to powers.
(True/False)
4.9/5  (34)
(34)
La Cabaña, a popular motel chain in the southwest, is interested in developing a regression model that can predict the occupancy rate (%) of its motels. Currently, the company is interested in using two explanatory variables to predict occupancy. They want to use the amount of advertising (in $) used by each motel and if the particular location a franchised location. Some regression information is presented below: 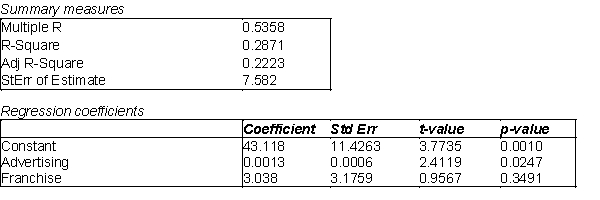 -(A) Use the information above to estimate the linear regression model.
(B) Interpret each of the estimated regression coefficients of the regression model in (A).
(C) Would any of the variables in this model be considered a dummy variable? Explain your answer.
(D) Identify and interpret the coefficient of determination (
-(A) Use the information above to estimate the linear regression model.
(B) Interpret each of the estimated regression coefficients of the regression model in (A).
(C) Would any of the variables in this model be considered a dummy variable? Explain your answer.
(D) Identify and interpret the coefficient of determination (  ) and the standard error of the estimate (se) for the model in (A).
(Essay)
4.7/5 (28)
The residual is defined as the difference between the actual and predicted, or fitted values of the response variable.
(True/False)
5.0/5 (36)
The primary purpose of a nonlinear transformation is to "straighten out" the data on a scatterplot.
(True/False)
5.0/5 (33)
The two primary objectives of regression analysis are to study relationships between variables and to use those relationships to make predictions.
(True/False)
4.7/5 (36)
In multiple regression, the coefficients reflect the expected change in:
(Multiple Choice)
4.8/5 (38)
Scatterplots are used for identifying outliers and quantifying relationships between variables.
(True/False)
4.9/5 (45)
An outlier is an observation that falls outside of the general pattern of the rest of the observations on a scatterplot.
(True/False)
4.8/5 (39)
A scatterplot that appears as a shapeless mass of data points indicates:
(Multiple Choice)
4.8/5 (32)
Filters
- Essay(0)
- Multiple Choice(0)
- Short Answer(0)
- True False(0)
- Matching(0)