Exam 10: Regression Analysis: Estimating Relationships
Exam 1: Introduction to Business Analytics29 Questions
Exam 2: Describing the Distribution of a Single Variable100 Questions
Exam 3: Finding Relationships Among Variables85 Questions
Exam 4: Probability and Probability Distributions114 Questions
Exam 5: Normal, Binomial, Poisson, and Exponential Distributions125 Questions
Exam 6: Decision Making Under Uncertainty107 Questions
Exam 7: Sampling and Sampling Distributions90 Questions
Exam 8: Confidence Interval Estimation84 Questions
Exam 9: Hypothesis Testing87 Questions
Exam 10: Regression Analysis: Estimating Relationships92 Questions
Exam 11: Regression Analysis: Statistical Inference82 Questions
Exam 12: Time Series Analysis and Forecasting106 Questions
Exam 13: Introduction to Optimization Modeling97 Questions
Exam 14: Optimization Models114 Questions
Exam 15: Introduction to Simulation Modeling82 Questions
Exam 16: Simulation Models102 Questions
Exam 17: Data Mining20 Questions
Exam 18: Importing Data Into Excel19 Questions
Exam 19: Analysis of Variance and Experimental Design20 Questions
Exam 20: Statistical Process Control20 Questions
Select questions type
Data collected from approximately the same period of time from a cross-section of a population are called:
(Multiple Choice)
4.9/5  (33)
(33)
A useful graph in almost any regression analysis is a scatterplot of residuals (on the vertical axis) versus fitted values (on the horizontal axis), where a "good" fit not only has small residuals, but it has residuals scattered randomly around zero with no apparent pattern.
(True/False)
4.8/5 (40)
In choosing the "best-fitting" line through a set of points in linear regression, we choose the one with the:
(Multiple Choice)
5.0/5 (42)
An interaction variable is the product of an explanatory variable and the dependent variable.
(True/False)
4.8/5 (35)
If a categorical variable is to be included in a multiple regression, a dummy variable for each category of the variable should be used, but the original categorical variables should not be sued.
(True/False)
4.7/5 (37)
If the regression equation includes anything other than a constant plus the sum of products of constants and variables, the model will not be linear.
(True/False)
4.9/5 (37)
The percentage of variation explained,  , is the square of the correlation between the observed Y values and the fitted Y values.
(True/False)
4.8/5 (42)
The human resource manager at Gamma, Inc. wants to examine the relationship between annual salaries (Y), the number of years employees have worked at Gamma, Inc. (  ) and whether the employee is male or female (
  ). They are also interested in whether the interaction between the two explanatory variables (
  ) has a significant impact on salaries. These data have been collected for a sample of 28 employees and the regression output is shown below.
 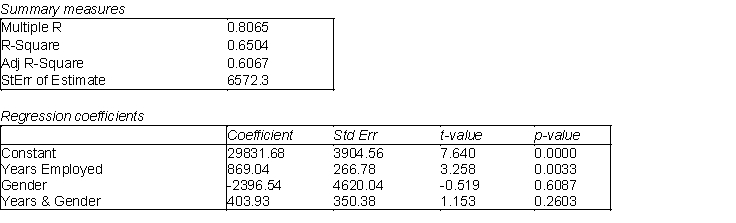 -(A) Use the information above to estimate the linear regression model.
(B) Write the regression equation in (A) as two separate equations; one for females and one for males, and interpret the results.
(C) Would any of the variables in the linear regression model in (A) be considered a dummy variable? Explain your answer.
(D) Identify and interpret the coefficient of determination (
-(A) Use the information above to estimate the linear regression model.
(B) Write the regression equation in (A) as two separate equations; one for females and one for males, and interpret the results.
(C) Would any of the variables in the linear regression model in (A) be considered a dummy variable? Explain your answer.
(D) Identify and interpret the coefficient of determination (  ) for the model in (A).
(E) Identify and interpret the standard error of estimate (se) for the model in (A).
) for the model in (A).
(E) Identify and interpret the standard error of estimate (se) for the model in (A).
(Essay)
4.9/5 (28)
In a simple linear regression problem, suppose that  = 12.48 and
  = 124.8. Then the percentage of variation explained
  must be 0.90.
(True/False)
4.8/5 (30)
In the multiple regression model 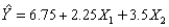 we interpret X1 as follows: holding X2 constant, if X1 increases by 1 unit, then the expected value of Y will increase by 9 units.
(True/False)
4.8/5 (37)
In a multiple regression analysis with three explanatory variables, suppose that there are 60 observations and the sum of the residuals squared is 28. The standard error of estimate must be 0.7071.
(True/False)
4.8/5 (25)
In a simple linear regression problem, if the percentage of variation explained  is 0.95, this means that 95% of the variation in the explanatory variable X can be explained by regression.
(True/False)
4.7/5 (35)
The adjusted R2 is adjusted for the number of explanatory variables in a regression equation, and it has he same interpretation as the standard R2.
(True/False)
4.9/5 (33)
For the multiple regression model 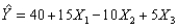 , if
, if  were to increase by 5 units, holding
  and
and  constant, the value of Y would be expected to decrease by 50 units.
(True/False)
4.9/5 (46)
In a simple regression analysis, if the standard error of estimate  = 15 and the number of observations n = 10, then the sum of the residuals squared must be 120.
(True/False)
4.8/5 (33)
The adjusted R2 is used primarily to monitor whether extra explanatory variables really belong in a multiple regression model.
(True/False)
4.9/5 (26)
Adjustors working for a large insurance agency are each given a company car which they use on the job to travel to client locations to inspect damage to homes and automobiles that are covered by the agency. Although the cars are owned by the agency, maintenance is currently left up to the discretion of the adjustors, who are reimbursed for any costs they report. The agency believes that the lack of a maintenance policy has led to unnecessary maintenance expenses. In particular, they believe that many agents wait too long to have maintenance performed on their company cars, and that in such cases, maintenance expenses are inordinately high. The agency recently conducted a study to investigate the relationship between the reported cost of maintenance visits for their company cars (Y) and the length of time since the last maintenance service (X). The sample data are shown below: 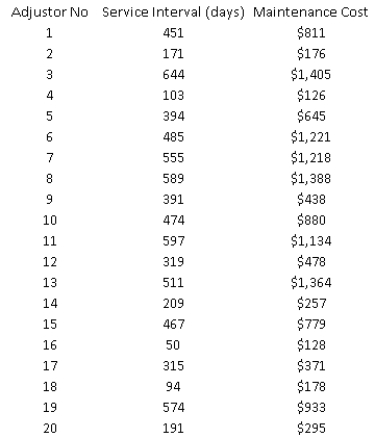 -(A) Estimate a simple linear regression model with Service Interval (X) and Maintenance Cost (Y). Interpret the slope coefficient of the least squares line as well as the computed value of
  .
(B) Do you think this model proves the agency's point about maintenance? Explain your answer.
(C) Obtain a residual plot vs. Service Interval. Does this affect your opinion of the validity of the model in (A)?
(D) Obtain a scatterplot of Maintenance Cost vs. Service Interval. Does this affect your opinion of the validity of the model in (A)?
(E) Use what you have learned about transformations to fit an alternative model to the one in (A).
(F) Interpret the model you developed in (E). Does it help you assess the agency's claim? What should the agency conclude about the relationship between service interval and maintenance costs?
.
(B) Do you think this model proves the agency's point about maintenance? Explain your answer.
(C) Obtain a residual plot vs. Service Interval. Does this affect your opinion of the validity of the model in (A)?
(D) Obtain a scatterplot of Maintenance Cost vs. Service Interval. Does this affect your opinion of the validity of the model in (A)?
(E) Use what you have learned about transformations to fit an alternative model to the one in (A).
(F) Interpret the model you developed in (E). Does it help you assess the agency's claim? What should the agency conclude about the relationship between service interval and maintenance costs?
(Essay)
4.8/5 (28)
Correlation is measured on a scale from 0 to 1, where 0 indicates no linear relationship between two variables, and 1 indicates a perfect linear relationship.
(True/False)
4.9/5 (43)
Filters
- Essay(0)
- Multiple Choice(0)
- Short Answer(0)
- True False(0)
- Matching(0)