Exam 10: Regression Analysis: Estimating Relationships
Exam 1: Introduction to Business Analytics29 Questions
Exam 2: Describing the Distribution of a Single Variable100 Questions
Exam 3: Finding Relationships Among Variables85 Questions
Exam 4: Probability and Probability Distributions114 Questions
Exam 5: Normal, Binomial, Poisson, and Exponential Distributions125 Questions
Exam 6: Decision Making Under Uncertainty107 Questions
Exam 7: Sampling and Sampling Distributions90 Questions
Exam 8: Confidence Interval Estimation84 Questions
Exam 9: Hypothesis Testing87 Questions
Exam 10: Regression Analysis: Estimating Relationships92 Questions
Exam 11: Regression Analysis: Statistical Inference82 Questions
Exam 12: Time Series Analysis and Forecasting106 Questions
Exam 13: Introduction to Optimization Modeling97 Questions
Exam 14: Optimization Models114 Questions
Exam 15: Introduction to Simulation Modeling82 Questions
Exam 16: Simulation Models102 Questions
Exam 17: Data Mining20 Questions
Exam 18: Importing Data Into Excel19 Questions
Exam 19: Analysis of Variance and Experimental Design20 Questions
Exam 20: Statistical Process Control20 Questions
Select questions type
A single variable X can explain a large percentage of the variation in some other variable Y when the two variables are:
(Multiple Choice)
4.8/5  (27)
(27)
The least squares line is the line that minimizes the sum of the residuals.
(True/False)
4.8/5 (27)
In linear regression, we can have an interaction variable. Algebraically, the interaction variable is the other variables in the regression equation.
(Multiple Choice)
4.8/5 (38)
If a scatterplot of residuals shows a parabola shape, then a logarithmic transformation may be useful in obtaining a better fit.
(True/False)
4.9/5 (36)
The regression line  has been fitted to the data points (28, 60), (20, 50), (10, 18), and (25, 55). The sum of the squared residuals will be:
(Multiple Choice)
4.8/5 (45)
In a multiple regression problem with two explanatory variables if, the fitted regression equation is  , then the estimated value of Y when
  and
and  is 49.4.
(True/False)
4.9/5 (31)
In linear regression, we fit the least squares line to a set of values (or points on a scatterplot). The distance from the line to a point is called the:
(Multiple Choice)
4.7/5 (39)
Correlation is used to determine the strength of the linear relationship between an explanatory variable X and response variable Y.
(True/False)
4.8/5 (24)
An express delivery service company recently conducted a study to investigate the relationship between the cost of shipping a package (Y), the package weight  , and the distance shipped
  . Twenty packages were randomly selected from among the large number received for shipment, and a detailed analysis of the shipping cost was conducted for each package. The sample information is shown in the table below:
 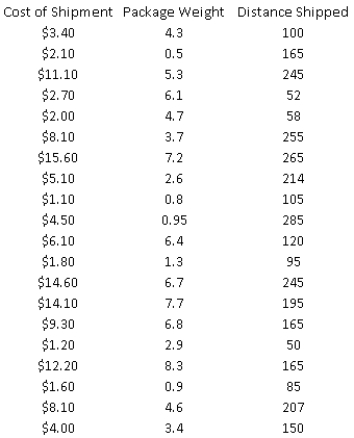 -(A) Estimate a simple linear regression model involving shipping cost and package weight. Interpret the slope coefficient of the least squares line as well as the computed value of
  .
(B) Add another explanatory variable - distance shipped - to the regression to (A). Estimate and interpret this expanded model. How does the
.
(B) Add another explanatory variable - distance shipped - to the regression to (A). Estimate and interpret this expanded model. How does the  value for this multiple regression model compare to that of the simple regression model estimated in (A)? Explain any difference between the two
  values. Compute and interpret the adjusted
  value for the revised model.
(C) Suppose that one of the managers of this express delivery service company is trying to decide whether to add an interaction term involving the package weight
value for the revised model.
(C) Suppose that one of the managers of this express delivery service company is trying to decide whether to add an interaction term involving the package weight  and the distance shipped
  in the multiple regression model developed previously. Why would the manager want to add such a term to the regression equation?
(D) Estimate the revised model using the interaction term suggested in (C).
(E) Interpret each of the estimated coefficients in your revised model in (D). In particular, how do you interpret the coefficient for the interaction term in the revised model?
(F) Does this revised model in (D) fit the given data better than the original multiple regression model in (B)? Explain why or why not.
in the multiple regression model developed previously. Why would the manager want to add such a term to the regression equation?
(D) Estimate the revised model using the interaction term suggested in (C).
(E) Interpret each of the estimated coefficients in your revised model in (D). In particular, how do you interpret the coefficient for the interaction term in the revised model?
(F) Does this revised model in (D) fit the given data better than the original multiple regression model in (B)? Explain why or why not.
(Essay)
4.9/5 (37)
A regression analysis between sales (in $1000) and advertising (in $100) resulted in the following least squares line:  = 84 +7X. This implies that if advertising is $800, then the predicted amount of sales (in dollars) is $140,000.
(True/False)
4.9/5 (34)
A logarithmic transformation of the response variable Y is often useful when the distribution of Y is symmetric.
(True/False)
4.9/5 (40)
A realtor in a local area is interested in being able to predict the selling price for a newly listed home or for someone considering listing their home. This realtor would like to attempt to predict the selling price by using the size of the home (  , in hundreds of square feet), the number of rooms (
  ), the age of the home (
  , in years) and if the home has an attached garage (
  ). Use the output below to determine if this realtor will be able to use this information to predict the selling price (in $1000).
 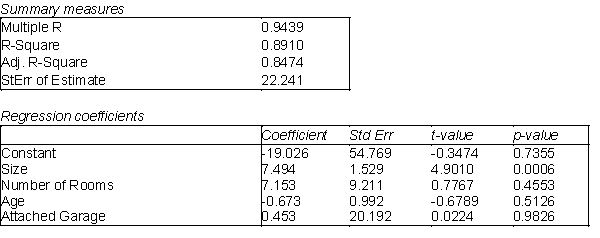 -(A) Use the information above to estimate the linear regression model.
(B) Interpret each of the estimated regression coefficients of the regression model in (A).
(C) Would any of the variables in this model be considered a dummy variable? Explain your answer.
(D) Identify and interpret the coefficient of determination (
-(A) Use the information above to estimate the linear regression model.
(B) Interpret each of the estimated regression coefficients of the regression model in (A).
(C) Would any of the variables in this model be considered a dummy variable? Explain your answer.
(D) Identify and interpret the coefficient of determination (  ) and the standard error of the estimate (se) for the model in (A).
(E) Use the estimated model in (A) to predict the sales price of a 2500 square feet, 15-year old house that has 5 rooms and an attached garage.
) and the standard error of the estimate (se) for the model in (A).
(E) Use the estimated model in (A) to predict the sales price of a 2500 square feet, 15-year old house that has 5 rooms and an attached garage.
(Essay)
4.9/5 (37)
The effect of a logarithmic transformation on a variable that is skewed to the right by a few large values is to "squeeze" the values together and make the distribution more symmetric.
(True/False)
4.9/5 (42)
A large auto dealership is interested in determining the number of cars that will be sold in a given quarter. The management of the dealership believes that a relationship can be found between the number of cars sold (Y), the advertised price (  ) and the current interest rates (
  ). Their past experience shows that they tend to have better luck using a non-linear relationship. Below is the output from a regression analysis using the natural logarithm of the variables in the model.
 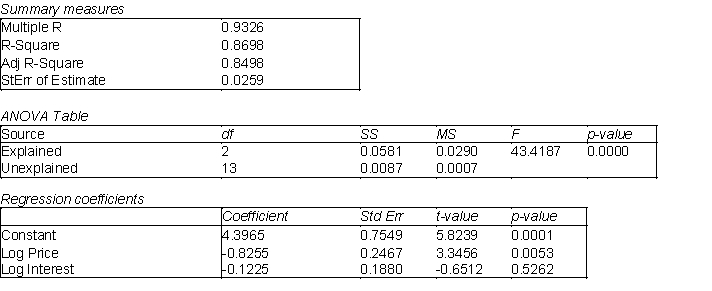 -(A) Use the information above to estimate the regression model.
(B) Interpret each of the estimated regression coefficients of the regression model in (A).
(C) Does using a non-linear model seem to be a good choice in this example? Explain your answer.
-(A) Use the information above to estimate the regression model.
(B) Interpret each of the estimated regression coefficients of the regression model in (A).
(C) Does using a non-linear model seem to be a good choice in this example? Explain your answer.
(Essay)
4.9/5 (39)
A regression analysis between weight (Y in pounds) and height (X in inches) resulted in the following least squares line:  = 140 + 5X. This implies that if the height is increased by 1 inch, the weight is expected to increase on average by 5 pounds.
(True/False)
4.7/5 (38)
Regression analysis can be applied equally well to cross-sectional and time series data.
(True/False)
4.7/5 (37)
The marketing manager of a large supermarket chain would like to determine the effect of shelf space (in feet) on the weekly sales of international food (in hundreds of dollars). A random sample of 12 equal-sized stores is selected, with the following results: 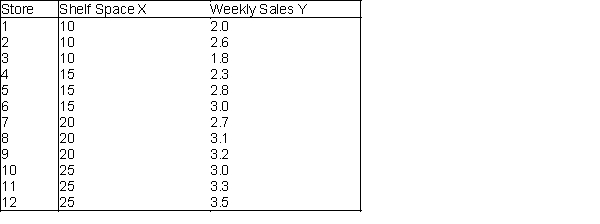 -(A) Draw a scatterplot,of the data and comment on the relationship between shelf space and weekly sales.
(B) Run a regression on this data set and report the results.
(C) What are the least squares regression coefficients of the Y-intercept (a) and slope (b)?
(D) Interpret the meaning of the slope
b.
(E) Predict the average weekly sales (in hundreds of dollars) of international food for stores with 13 feet of shelf space for international food.
(F) Why would it not be appropriate to predict the average weekly sales (in hundreds of dollars) of international food for stores with 35 feet of shelf space for international food?
(G) Identify the coefficient of determination,
-(A) Draw a scatterplot,of the data and comment on the relationship between shelf space and weekly sales.
(B) Run a regression on this data set and report the results.
(C) What are the least squares regression coefficients of the Y-intercept (a) and slope (b)?
(D) Interpret the meaning of the slope
b.
(E) Predict the average weekly sales (in hundreds of dollars) of international food for stores with 13 feet of shelf space for international food.
(F) Why would it not be appropriate to predict the average weekly sales (in hundreds of dollars) of international food for stores with 35 feet of shelf space for international food?
(G) Identify the coefficient of determination,  , and interpret its meaning.
(H) Determine the standard error of the estimate. What does it represent?
(I) Draw a scatterplot of residuals versus fitted values. What does this graph indicate?
, and interpret its meaning.
(H) Determine the standard error of the estimate. What does it represent?
(I) Draw a scatterplot of residuals versus fitted values. What does this graph indicate?
(Essay)
5.0/5 (32)
A new online auction site specializes in selling automotive parts for classic cars. The founder of the company believes that the price received for a particular item increases with its age (i.e., the age of the car on which the item can be used in years) and with the number of bidders. The multiple regression output is shown below. 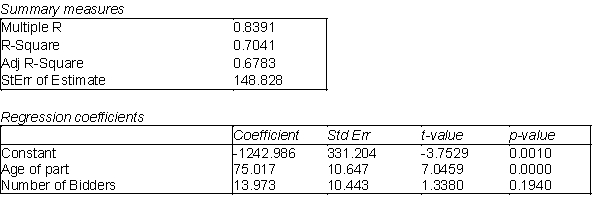 -(A) Use the information above to estimate the linear regression model.
(B) Interpret each of the estimated regression coefficients of the regression model in (A).
(C) Identify and interpret the coefficient of determination (
-(A) Use the information above to estimate the linear regression model.
(B) Interpret each of the estimated regression coefficients of the regression model in (A).
(C) Identify and interpret the coefficient of determination (  ) for the model in (A).
(D) Identify and interpret the standard error of the estimate (se) for the model in (A).
(E) Would you recommend that this company examine any other factors to predict the selling price? If yes, what other factors would you want to consider? Explain your answer.
) for the model in (A).
(D) Identify and interpret the standard error of the estimate (se) for the model in (A).
(E) Would you recommend that this company examine any other factors to predict the selling price? If yes, what other factors would you want to consider? Explain your answer.
(Essay)
4.7/5 (41)
An automobile rental company wants to predict the yearly maintenance expense (Y) for an automobile using the number of miles driven during the year (  ) and the age of the car (
  , in years) at the beginning of the year. The company has gathered the data on 10 automobiles and run a regression analysis with the results shown below:.
 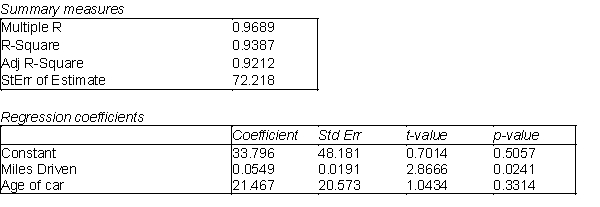 -(A) Use the information above to estimate the linear regression model.
(B) Interpret each of the estimated regression coefficients of the regression model in (A).
(C) Identify and interpret the coefficient of determination (
-(A) Use the information above to estimate the linear regression model.
(B) Interpret each of the estimated regression coefficients of the regression model in (A).
(C) Identify and interpret the coefficient of determination (  ), for the model in (A).
(D) Identify and interpret the adjusted
), for the model in (A).
(D) Identify and interpret the adjusted  for the model in (A).
(Essay)
4.7/5 (34)
Filters
- Essay(0)
- Multiple Choice(0)
- Short Answer(0)
- True False(0)
- Matching(0)