Exam 10: Regression Analysis: Estimating Relationships
Exam 1: Introduction to Business Analytics29 Questions
Exam 2: Describing the Distribution of a Single Variable100 Questions
Exam 3: Finding Relationships Among Variables85 Questions
Exam 4: Probability and Probability Distributions114 Questions
Exam 5: Normal, Binomial, Poisson, and Exponential Distributions125 Questions
Exam 6: Decision Making Under Uncertainty107 Questions
Exam 7: Sampling and Sampling Distributions90 Questions
Exam 8: Confidence Interval Estimation84 Questions
Exam 9: Hypothesis Testing87 Questions
Exam 10: Regression Analysis: Estimating Relationships92 Questions
Exam 11: Regression Analysis: Statistical Inference82 Questions
Exam 12: Time Series Analysis and Forecasting106 Questions
Exam 13: Introduction to Optimization Modeling97 Questions
Exam 14: Optimization Models114 Questions
Exam 15: Introduction to Simulation Modeling82 Questions
Exam 16: Simulation Models102 Questions
Exam 17: Data Mining20 Questions
Exam 18: Importing Data Into Excel19 Questions
Exam 19: Analysis of Variance and Experimental Design20 Questions
Exam 20: Statistical Process Control20 Questions
Select questions type
In a simple regression with a single explanatory variable, the multiple R is the same as the standard correlation between the Y variable and the explanatory X variable.
(True/False)
4.8/5  (32)
(32)
To help explain or predict the response variable in every regression study, we use one or more explanatory variables. These variables are also called response variables or independent variables.
(True/False)
4.8/5 (39)
The multiple R for a regression is the correlation between the observed Y values and the fitted Y values.
.
(True/False)
4.9/5 (37)
In regression analysis, the variable we are trying to explain or predict is called the:
(Multiple Choice)
4.8/5 (41)
The information below represents the relationship between the selling price (Y, in $1000) of a home, the square footage of the home (  ), and the number of bedrooms in the home (
  ). The data represents 65 homes sold in a particular area of a city and was analyzed using simple linear regression for each independent variable.
 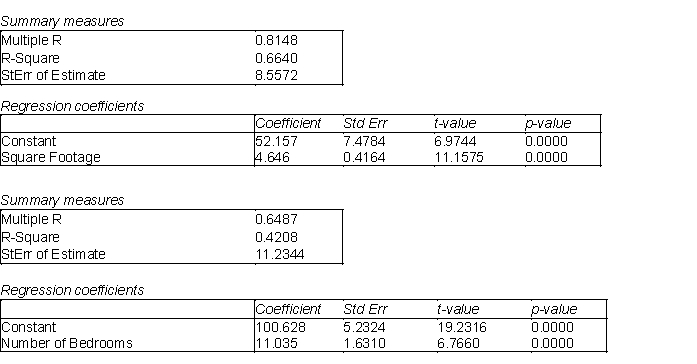 -(A) Is there evidence of a linear relationship between the selling price and the square footage of the homes? If so, interpret the least squares line and characterize the relationship (i.e., positive, negative, strong, weak, etc.).
(B) Identify and interpret the coefficient of determination (
-(A) Is there evidence of a linear relationship between the selling price and the square footage of the homes? If so, interpret the least squares line and characterize the relationship (i.e., positive, negative, strong, weak, etc.).
(B) Identify and interpret the coefficient of determination (  ) for the model in (A).
(C) Identify and interpret the standard error of estimate
) for the model in (A).
(C) Identify and interpret the standard error of estimate  for the model in (A).
(D) Is there evidence of a linear relationship between the selling price and number of bedrooms of the homes? If so, interpret the least squares line and characterize the relationship (i.e., positive, negative, strong, weak, etc.).
(E) Identify and interpret the coefficient of determination (
for the model in (A).
(D) Is there evidence of a linear relationship between the selling price and number of bedrooms of the homes? If so, interpret the least squares line and characterize the relationship (i.e., positive, negative, strong, weak, etc.).
(E) Identify and interpret the coefficient of determination (  ) for the model in (D).
(F) Identify and interpret the standard error of the estimate (
) for the model in (D).
(F) Identify and interpret the standard error of the estimate (  ) for the model in (C).
(G) Which of the two variables, the square footage or the number of bedrooms, is the relationship with home selling price stronger? Justify your choice.
) for the model in (C).
(G) Which of the two variables, the square footage or the number of bedrooms, is the relationship with home selling price stronger? Justify your choice.
(Essay)
4.9/5 (30)
The covariance is not used as much as the correlation because:
(Multiple Choice)
4.9/5 (34)
Given the least squares regression line,  , which statement is true?
(Multiple Choice)
4.9/5 (38)
A regression analysis between sales (in $1000) and advertising (in $) resulted in the following least squares line:  = 32 + 8X. This implies that an increase of $1 in advertising is expected to result in an increase of $40 in sales.
(True/False)
5.0/5 (41)
In reference to the equation,  , the value 0.10 is the expected change in Y per unit change in
  .
.
(True/False)
4.8/5 (33)
A negative relationship between an explanatory variable X and a response variable Y means that as X increases, Y decreases, and vice versa.
(True/False)
4.7/5 (37)
When the scatterplot appears as a shapeless swarm of points, this can indicate that there is no relationship between the response variable Y and the explanatory variable X, or at least none worth pursuing.
(True/False)
4.7/5 (35)
Cross-sectional data are usually data gathered from approximately the same period of time from a cross-sectional of a population.
(True/False)
4.7/5 (34)
In a nonlinear transformation of data, the Y variable or the X variables may be transformed, but not both.
(True/False)
4.8/5 (34)
The regression line  = 3 + 2X has been fitted to the data points (4, 14), (2, 7), and (1, 4). The sum of the residuals squared will be 8.0.
(True/False)
4.9/5 (33)
The percentage of variation (  ) can be interpreted as the fraction (or percent) of variation of the
(Multiple Choice)
5.0/5 (35)
In regression analysis, we can often use the standard error of estimate  to judge which of several potential regression equations is the most useful.
(True/False)
4.8/5 (41)
Filters
- Essay(0)
- Multiple Choice(0)
- Short Answer(0)
- True False(0)
- Matching(0)