Exam 16: Regression Analysis: Model Building
Exam 1: Data and Statistics98 Questions
Exam 2: Descriptive Statistics: Tabular and Graphical Displays62 Questions
Exam 3: Descriptive Statistics: Numerical Measures173 Questions
Exam 4: Introduction to Probability138 Questions
Exam 5: Discrete Probability Distributions123 Questions
Exam 6: Continuous Probability Distributions174 Questions
Exam 7: Sampling and Sampling Distributions133 Questions
Exam 8: Interval Estimation137 Questions
Exam 9: Hypothesis Tests148 Questions
Exam 10: Inference About Means and Proportions With Two Populations121 Questions
Exam 11: Inferences About Population Variances90 Questions
Exam 12: Comparing Multiple Proportions, Test of Independence and Goodness of Fit90 Questions
Exam 13: Experimental Design and Analysis of Variance115 Questions
Exam 14: Simple Linear Regression146 Questions
Exam 15: Multiple Regression115 Questions
Exam 16: Regression Analysis: Model Building76 Questions
Exam 17: Time Series Analysis and Forecasting68 Questions
Exam 18: Nonparametric Methods81 Questions
Exam 19: Statistical Methods for Quality Control29 Questions
Exam 20: Index Numbers52 Questions
Exam 21: Decision Analysis on Website65 Questions
Exam 22: Sample Survey on Website63 Questions
Select questions type
A regression model relating a dependent variable, Y, with one independent variable, X1, resulted in an SSE of 400. Another regression model with the same dependent variable, Y, and two independent variables, X1 and X2, resulted in an SSE of 320. At = .05, determine if X2 contributed significantly to the model. The sample size for both models was 20.
(Essay)
4.9/5  (43)
(43)
Multiple regression analysis was used to study the relationship between a dependent variable, Y, and three independent variables X1, X2 and, X3. The following is a partial result of the regression analysis involving 20 observations. 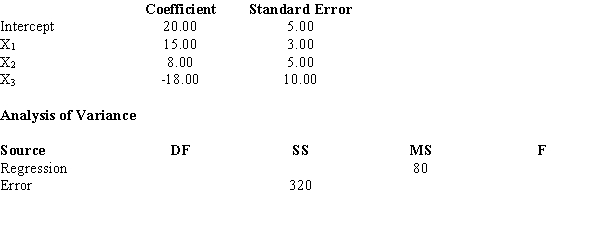 a.Compute the coefficient of determination.
b.Perform a t test and determine whether or not 1 is significantly different from zero ( = 0.05).
c.Perform a t test and determine whether or not 2 is significantly different from zero ( = 0.05).
d.Perform a t test and determine whether or not 3 is significantly different from zero ( = 0.05).
e.At = 0.05, perform an F test and determine whether or not the regression model is significant.
a.Compute the coefficient of determination.
b.Perform a t test and determine whether or not 1 is significantly different from zero ( = 0.05).
c.Perform a t test and determine whether or not 2 is significantly different from zero ( = 0.05).
d.Perform a t test and determine whether or not 3 is significantly different from zero ( = 0.05).
e.At = 0.05, perform an F test and determine whether or not the regression model is significant.
(Essay)
4.8/5 (29)
Exhibit 16-2
In a regression model involving 30 observations, the following estimated regression equation was obtained. 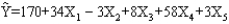 For this model, SSR = 1,740 and SST = 2,000.
-Refer to Exhibit 16-2. The value of SSE is
For this model, SSR = 1,740 and SST = 2,000.
-Refer to Exhibit 16-2. The value of SSE is
(Multiple Choice)
4.7/5 (39)
Exhibit 16-1
In a regression analysis involving 25 observations, the following estimated regression equation was developed. 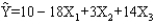 Also, the following standard errors and the sum of squares were obtained.
Sb1 = 3
Sb2 = 6
Sb3 = 7
SST = 4,800
SSE = 1,296
-Refer to Exhibit 16-1. If we are interested in testing for the significance of the relationship among the variables (i.e., significance of the model) the critical value of F at = 0.05 is
Also, the following standard errors and the sum of squares were obtained.
Sb1 = 3
Sb2 = 6
Sb3 = 7
SST = 4,800
SSE = 1,296
-Refer to Exhibit 16-1. If we are interested in testing for the significance of the relationship among the variables (i.e., significance of the model) the critical value of F at = 0.05 is
(Multiple Choice)
4.8/5 (37)
Exhibit 16-2
In a regression model involving 30 observations, the following estimated regression equation was obtained. For this model, SSR = 1,740 and SST = 2,000.
-Refer to Exhibit 16-2. The test statistic F for testing the significance of the above model is
(Multiple Choice)
4.9/5 (35)
Exhibit 16-3
Below you are given a partial computer output based on a sample of 25 observations. 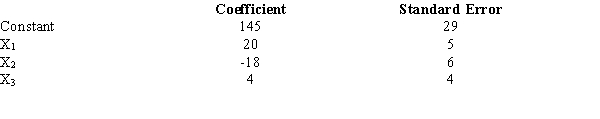 -Refer to Exhibit 16-3. The estimated regression equation is
(Multiple Choice)
4.8/5 (32)
Consider the following data for two variables x and y. 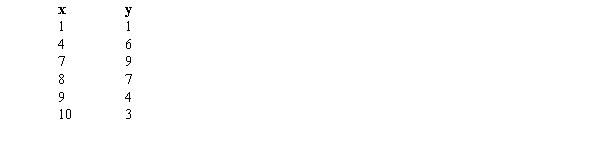 a.An estimated regression equation of the form
  was developed for the above data and the results are shown below. Comment on the adequacy of this equation for predicting y. Let = .05.
 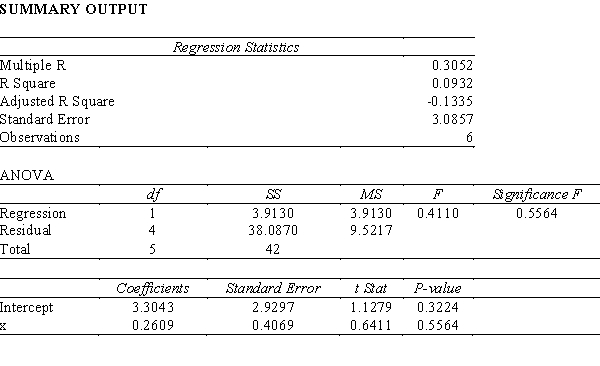 b.A regression equation of the form
 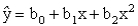 was developed for the above data and results are shown below. Comment on the adequacy of this equation for predicting y. Let
= .05.
was developed for the above data and results are shown below. Comment on the adequacy of this equation for predicting y. Let
= .05. 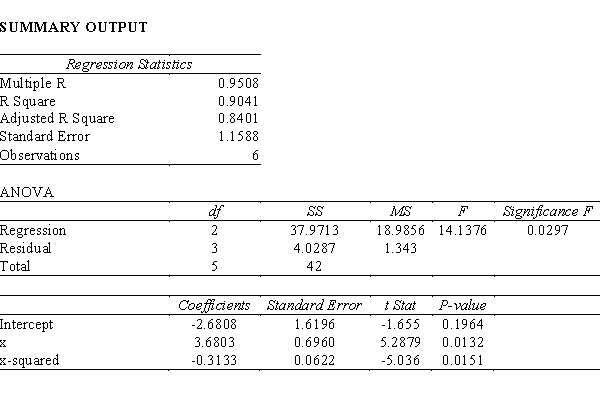 c.Predict the value of y when x = 5.
(Essay)
5.0/5 (37)
Exhibit 16-3
Below you are given a partial computer output based on a sample of 25 observations.
-Refer to Exhibit 16-3. We want to test whether the parameter 2 is significant. The test statistic equals
(Multiple Choice)
4.8/5 (32)
Which of the following tests is used to determine whether an additional variable makes a significant contribution to a multiple regression model?
(Multiple Choice)
4.8/5 (34)
Exhibit 16-3
Below you are given a partial computer output based on a sample of 25 observations.
-Refer to Exhibit 16-3. The critical t value obtained from the table to test an individual parameter at the 5% level is
(Multiple Choice)
4.9/5 (31)
A regression analysis relating a company's sales, their advertising expenditure, price, and time resulted in the following. 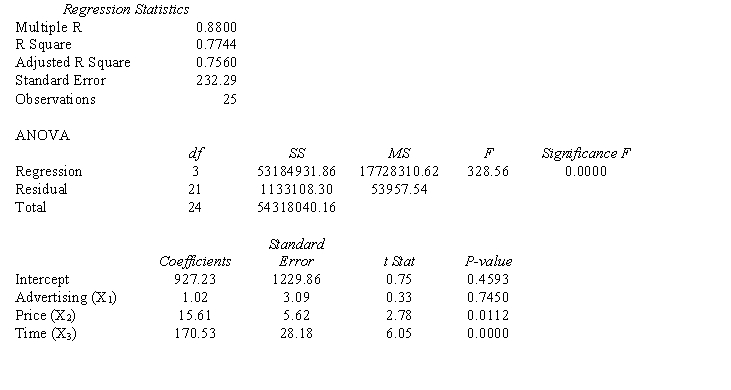 a.At 95% confidence, determine whether or not the regression model is significant. Fully explain how you arrived at your conclusion (give numerical reasoning) and what your answer indicates.
b.At 95% confidence determine which variables are significant and which are not. Explain how you arrived at your conclusion (Give numerical reasoning).
c.Fully explain the meaning of R-square, which is given in this model. Be very specific and give numerical explanation.
a.At 95% confidence, determine whether or not the regression model is significant. Fully explain how you arrived at your conclusion (give numerical reasoning) and what your answer indicates.
b.At 95% confidence determine which variables are significant and which are not. Explain how you arrived at your conclusion (Give numerical reasoning).
c.Fully explain the meaning of R-square, which is given in this model. Be very specific and give numerical explanation.
(Essay)
4.8/5 (27)
Consider the following data. 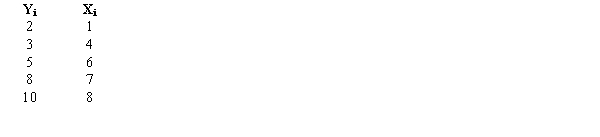 a.Draw a scatter diagram. Does the relationship between X and Y appear to be linear?
b.Assume the relationship between X and Y can best be given by
a.Draw a scatter diagram. Does the relationship between X and Y appear to be linear?
b.Assume the relationship between X and Y can best be given by  Estimate the parameters of this curvilinear function.
(Essay)
4.9/5 (25)
A model in the form of y = 0 + 1z1 + 2z2 + . . . + pzp + where each independent variable zj (for j = 1, 2, . . ., p) is a function of xj . xj is known as the
(Multiple Choice)
4.9/5 (39)
Exhibit 16-4
In a laboratory experiment, data were gathered on the life span (Y in months) of 33 rats, units of daily protein intake (X1), and whether or not agent X2 (a proposed life extending agent) was added to the rats diet (X2 = 0 if agent X2 was not added, and X2 = 1 if agent was added.) From the results of the experiment, the following regression model was developed. 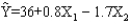 Also provided are SSR = 60 and SST = 180.
-Refer to Exhibit 16-4. The multiple coefficient of determination is
Also provided are SSR = 60 and SST = 180.
-Refer to Exhibit 16-4. The multiple coefficient of determination is
(Multiple Choice)
4.9/5 (45)
A researcher is trying to decide whether or not to add another variable to his model. He has estimated the following model from a sample of 28 observations. 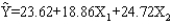 SSE = 1,425
SSR = 1,326
He has also estimated the model with an additional variable X3. The results are
SSE = 1,425
SSR = 1,326
He has also estimated the model with an additional variable X3. The results are  SSE = 1,300
SSR = 1,451
What advice would you give this researcher? Use a .05 level of significance.
SSE = 1,300
SSR = 1,451
What advice would you give this researcher? Use a .05 level of significance.
(Essay)
4.8/5 (34)
A data set consisting of 7 observations of a dependent variable y and two independent variables x1 and x2 was used in a regression analysis. Using (x1) as the only independent variable, the following function is provided.  = 0.408 + 1.338x1
The SSE for the above model is 39.535.
Using both x1 and x2 as independent variables yields the following function.
= 0.408 + 1.338x1
The SSE for the above model is 39.535.
Using both x1 and x2 as independent variables yields the following function.  = 0.805 + 0.498x1 - 0.477x2
The SSE for this latter function is 1.015.
Use an F test and determine if x2 contributes significantly to the model. Let = 0.05.
= 0.805 + 0.498x1 - 0.477x2
The SSE for this latter function is 1.015.
Use an F test and determine if x2 contributes significantly to the model. Let = 0.05.
(Essay)
4.8/5 (38)
Exhibit 16-2
In a regression model involving 30 observations, the following estimated regression equation was obtained. For this model, SSR = 1,740 and SST = 2,000.
-Refer to Exhibit 16-2. The coefficient of determination for this model is
(Multiple Choice)
4.8/5 (26)
Forty-eight observations of a dependent variable (Y) and five independent variables resulted in an SSE of 438. When two additional independent variables were added to the model, the SSE was reduced to 375. At 95% confidence, determine whether or not the two additional independent variables contribute significantly to the model.
(Essay)
4.8/5 (37)
Exhibit 16-2
In a regression model involving 30 observations, the following estimated regression equation was obtained. For this model, SSR = 1,740 and SST = 2,000.
-Refer to Exhibit 16-2. The degrees of freedom associated with SSE are
(Multiple Choice)
4.8/5 (40)
Filters
- Essay(0)
- Multiple Choice(0)
- Short Answer(0)
- True False(0)
- Matching(0)