Exam 16: Regression Analysis: Model Building
Exam 1: Data and Statistics98 Questions
Exam 2: Descriptive Statistics: Tabular and Graphical Displays62 Questions
Exam 3: Descriptive Statistics: Numerical Measures173 Questions
Exam 4: Introduction to Probability138 Questions
Exam 5: Discrete Probability Distributions123 Questions
Exam 6: Continuous Probability Distributions174 Questions
Exam 7: Sampling and Sampling Distributions133 Questions
Exam 8: Interval Estimation137 Questions
Exam 9: Hypothesis Tests148 Questions
Exam 10: Inference About Means and Proportions With Two Populations121 Questions
Exam 11: Inferences About Population Variances90 Questions
Exam 12: Comparing Multiple Proportions, Test of Independence and Goodness of Fit90 Questions
Exam 13: Experimental Design and Analysis of Variance115 Questions
Exam 14: Simple Linear Regression146 Questions
Exam 15: Multiple Regression115 Questions
Exam 16: Regression Analysis: Model Building76 Questions
Exam 17: Time Series Analysis and Forecasting68 Questions
Exam 18: Nonparametric Methods81 Questions
Exam 19: Statistical Methods for Quality Control29 Questions
Exam 20: Index Numbers52 Questions
Exam 21: Decision Analysis on Website65 Questions
Exam 22: Sample Survey on Website63 Questions
Select questions type
Exhibit 16-1
In a regression analysis involving 25 observations, the following estimated regression equation was developed. 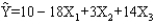 Also, the following standard errors and the sum of squares were obtained.
Sb1 = 3
Sb2 = 6
Sb3 = 7
SST = 4,800
SSE = 1,296
-Refer to Exhibit 16-1. The test statistic for testing the significance of the model is
Also, the following standard errors and the sum of squares were obtained.
Sb1 = 3
Sb2 = 6
Sb3 = 7
SST = 4,800
SSE = 1,296
-Refer to Exhibit 16-1. The test statistic for testing the significance of the model is
(Multiple Choice)
4.8/5  (28)
(28)
Exhibit 16-2
In a regression model involving 30 observations, the following estimated regression equation was obtained. 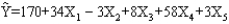 For this model, SSR = 1,740 and SST = 2,000.
-Refer to Exhibit 16-2. The value of MSE is
For this model, SSR = 1,740 and SST = 2,000.
-Refer to Exhibit 16-2. The value of MSE is
(Multiple Choice)
4.9/5 (32)
Exhibit 16-4
In a laboratory experiment, data were gathered on the life span (Y in months) of 33 rats, units of daily protein intake (X1), and whether or not agent X2 (a proposed life extending agent) was added to the rats diet (X2 = 0 if agent X2 was not added, and X2 = 1 if agent was added.) From the results of the experiment, the following regression model was developed. 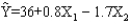 Also provided are SSR = 60 and SST = 180.
-Refer to Exhibit 16-4. The p-value for testing the significance of the regression model is
Also provided are SSR = 60 and SST = 180.
-Refer to Exhibit 16-4. The p-value for testing the significance of the regression model is
(Multiple Choice)
4.8/5 (39)
Exhibit 16-2
In a regression model involving 30 observations, the following estimated regression equation was obtained. For this model, SSR = 1,740 and SST = 2,000.
-Refer to Exhibit 16-2. The p-value for testing the significance of the regression model is
(Multiple Choice)
4.8/5 (39)
A regression model relating the yearly income (Y), age (X1), and the gender of the faculty member of a university (X2 = 1 if female and 0 if male) resulted in the following information. 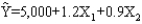
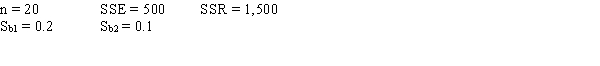 a.Is gender a significant variable?
b.Determine the multiple coefficient of determination.
a.Is gender a significant variable?
b.Determine the multiple coefficient of determination.
(Essay)
4.7/5 (34)
Exhibit 16-2
In a regression model involving 30 observations, the following estimated regression equation was obtained. For this model, SSR = 1,740 and SST = 2,000.
-Refer to Exhibit 16-2. The degrees of freedom associated with SST are
(Multiple Choice)
4.9/5 (32)
Exhibit 16-4
In a laboratory experiment, data were gathered on the life span (Y in months) of 33 rats, units of daily protein intake (X1), and whether or not agent X2 (a proposed life extending agent) was added to the rats diet (X2 = 0 if agent X2 was not added, and X2 = 1 if agent was added.) From the results of the experiment, the following regression model was developed. Also provided are SSR = 60 and SST = 180.
-Refer to Exhibit 16-4. From the above function, it can be said that the life expectancy of rats that were given agent X2 is
(Multiple Choice)
4.8/5 (27)
A regression analysis was applied in order to determine the relationship between a dependent variable and 8 independent variables. The following information was obtained from the regression analysis.
R Square = 0.80
SSR = 4,280
Total number of observations n = 56
a.Fill in the blanks in the following ANOVA table.
b.Is the model significant? Let = 0.05. 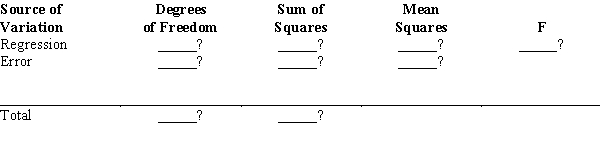
(Essay)
4.8/5 (40)
Exhibit 16-1
In a regression analysis involving 25 observations, the following estimated regression equation was developed. Also, the following standard errors and the sum of squares were obtained.
Sb1 = 3
Sb2 = 6
Sb3 = 7
SST = 4,800
SSE = 1,296
-Refer to Exhibit 16-1. The p-value for testing the significance of the regression model is
(Multiple Choice)
4.8/5 (42)
Exhibit 16-4
In a laboratory experiment, data were gathered on the life span (Y in months) of 33 rats, units of daily protein intake (X1), and whether or not agent X2 (a proposed life extending agent) was added to the rats diet (X2 = 0 if agent X2 was not added, and X2 = 1 if agent was added.) From the results of the experiment, the following regression model was developed. Also provided are SSR = 60 and SST = 180.
-Refer to Exhibit 16-4. The life expectancy of a rat that was given 3 units of protein daily, and who took agent X2 is
(Multiple Choice)
4.8/5 (29)
Monthly total production costs and the number of units produced at a local company over a period of 10 months are shown below. 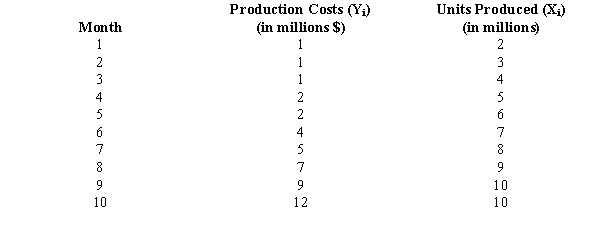 a.Draw a scatter diagram for the above data.
b.Assume that a model in the form of
a.Draw a scatter diagram for the above data.
b.Assume that a model in the form of  best describes the relationship between X and Y. Estimate the parameters of this curvilinear regression equation.
(Essay)
4.8/5 (34)
Thirty-four observations of a dependent variable (Y) and two independent variables resulted in an SSE of 300. When a third independent variable was added to the model, the SSE was reduced to 250. At 95% confidence, determine whether or not the third independent variable contributes significantly to the model.
(Essay)
4.8/5 (34)
Exhibit 16-4
In a laboratory experiment, data were gathered on the life span (Y in months) of 33 rats, units of daily protein intake (X1), and whether or not agent X2 (a proposed life extending agent) was added to the rats diet (X2 = 0 if agent X2 was not added, and X2 = 1 if agent was added.) From the results of the experiment, the following regression model was developed. Also provided are SSR = 60 and SST = 180.
-Refer to Exhibit 16-4. The degrees of freedom associated with SSE are
(Multiple Choice)
4.9/5 (38)
Exhibit 16-2
In a regression model involving 30 observations, the following estimated regression equation was obtained. For this model, SSR = 1,740 and SST = 2,000.
-Refer to Exhibit 16-2. The value of MSR is
(Multiple Choice)
4.9/5 (33)
Filters
- Essay(0)
- Multiple Choice(0)
- Short Answer(0)
- True False(0)
- Matching(0)