Exam 15: Multiple Regression
Exam 1: Data and Statistics98 Questions
Exam 2: Descriptive Statistics: Tabular and Graphical Displays62 Questions
Exam 3: Descriptive Statistics: Numerical Measures173 Questions
Exam 4: Introduction to Probability138 Questions
Exam 5: Discrete Probability Distributions123 Questions
Exam 6: Continuous Probability Distributions174 Questions
Exam 7: Sampling and Sampling Distributions133 Questions
Exam 8: Interval Estimation137 Questions
Exam 9: Hypothesis Tests148 Questions
Exam 10: Inference About Means and Proportions With Two Populations121 Questions
Exam 11: Inferences About Population Variances90 Questions
Exam 12: Comparing Multiple Proportions, Test of Independence and Goodness of Fit90 Questions
Exam 13: Experimental Design and Analysis of Variance115 Questions
Exam 14: Simple Linear Regression146 Questions
Exam 15: Multiple Regression115 Questions
Exam 16: Regression Analysis: Model Building76 Questions
Exam 17: Time Series Analysis and Forecasting68 Questions
Exam 18: Nonparametric Methods81 Questions
Exam 19: Statistical Methods for Quality Control29 Questions
Exam 20: Index Numbers52 Questions
Exam 21: Decision Analysis on Website65 Questions
Exam 22: Sample Survey on Website63 Questions
Select questions type
The following is part of the results of a regression analysis involving sales (Y in millions of dollars), advertising expenditures (X1 in thousands of dollars), and number of salespeople (X2) for a corporation. The regression was performed on a sample of 10 observations. 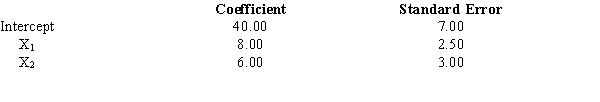 a.If the company uses $40,000 in advertisement and has 30 salespersons, what are the expected sales? Give your answer in dollars.
b.At = 0.05, test for the significance of the coefficient of advertising.
c.At = 0.05, test for the significance of the coefficient of the number of salespeople.
a.If the company uses $40,000 in advertisement and has 30 salespersons, what are the expected sales? Give your answer in dollars.
b.At = 0.05, test for the significance of the coefficient of advertising.
c.At = 0.05, test for the significance of the coefficient of the number of salespeople.
(Essay)
4.9/5  (38)
(38)
A multiple regression model has the form  As X increases by 1 unit (holding W constant), Y is expected to
(Multiple Choice)
5.0/5 (41)
Exhibit 15-6
Below you are given a partial computer output based on a sample of 16 observations. 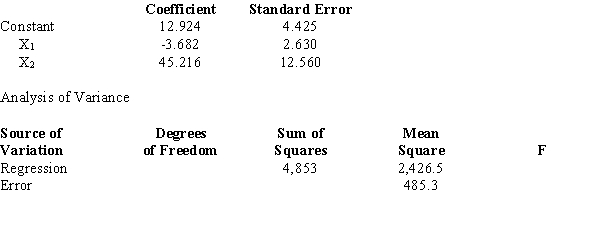 -Refer to Exhibit 15-6. We want to test whether the parameter 1 is significant. The test statistic equals
(Multiple Choice)
4.9/5 (39)
In a multiple regression model, the variance of the error term is assumed to be
(Multiple Choice)
4.8/5 (30)
The following regression model has been proposed to predict monthly sales at a shoe store. 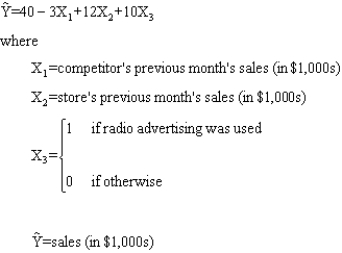 a.Predict sales (in dollars) for the shoe store if the competitor's previous month's sales were $9,000, the store's previous month's sales were $30,000, and no radio advertisements were run.
b.Predict sales (in dollars) for the shoe store if the competitor's previous month's sales were $9,000, the store's previous month's sales were $30,000, and 10 radio advertisements were run.
a.Predict sales (in dollars) for the shoe store if the competitor's previous month's sales were $9,000, the store's previous month's sales were $30,000, and no radio advertisements were run.
b.Predict sales (in dollars) for the shoe store if the competitor's previous month's sales were $9,000, the store's previous month's sales were $30,000, and 10 radio advertisements were run.
(Short Answer)
4.8/5 (38)
Exhibit 15-6
Below you are given a partial computer output based on a sample of 16 observations.
-Refer to Exhibit 15-6. The sum of squares due to error (SSE) equals
(Multiple Choice)
4.9/5 (34)
In a multiple regression analysis involving 15 independent variables and 200 observations, SST = 800 and SSE = 240. The coefficient of determination is
(Multiple Choice)
4.9/5 (32)
Exhibit 15-6
Below you are given a partial computer output based on a sample of 16 observations.
-Refer to Exhibit 15-6. Carry out the test to determine if there is a relationship among the variables at the 5% level. The null hypothesis should
(Multiple Choice)
4.9/5 (37)
For a multiple regression model, SSR = 600 and SSE = 200. The multiple coefficient of determination is
(Multiple Choice)
4.9/5 (38)
A regression model involved 5 independent variables and 136 observations. The critical value of t for testing the significance of each of the independent variable's coefficients will have
(Multiple Choice)
4.8/5 (38)
Exhibit 15-8
The following estimated regression model was developed relating yearly income (Y in $1,000s) of 30 individuals with their age (X1) and their gender (X2) (0 if male and 1 if female). 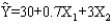 Also provided are SST = 1,200 and SSE = 384.
-Refer to Exhibit 15-8. If we want to test for the significance of the model, the critical value of F at 95% confidence is
Also provided are SST = 1,200 and SSE = 384.
-Refer to Exhibit 15-8. If we want to test for the significance of the model, the critical value of F at 95% confidence is
(Multiple Choice)
4.7/5 (27)
Exhibit 15-4
a. 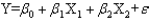 b.
b. 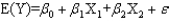 c.
c. 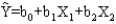 d.
d. 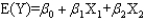 -Which equation describes the multiple regression model?
(Multiple Choice)
4.7/5 (36)
A regression analysis involved 6 independent variables and 27 observations. The critical value of t for testing the significance of each of the independent variable's coefficients will have
(Multiple Choice)
4.8/5 (22)
Below you are given a partial computer output based on a sample of 12 observations relating the number of personal computers sold by a computer shop per month (Y), unit price (X1 in $1,000) and the number of advertising spots (X2) used on a local television station. 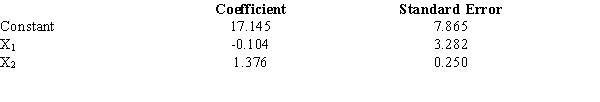 a. Use the output shown above and write an equation that can be used to predict the monthly sales of computers.
b. Interpret the coefficients of the estimated regression equation found in Part a.c. If the company charges $2,000 for each computer and uses 10 advertising spots, how many computers would you expect them to sell?
d. At = 0.05, test to determine if the price is a significant variable.e. At = 0.05, test to determine if the number of advertising spots is a significant variable.
a. Use the output shown above and write an equation that can be used to predict the monthly sales of computers.
b. Interpret the coefficients of the estimated regression equation found in Part a.c. If the company charges $2,000 for each computer and uses 10 advertising spots, how many computers would you expect them to sell?
d. At = 0.05, test to determine if the price is a significant variable.e. At = 0.05, test to determine if the number of advertising spots is a significant variable.
(Essay)
4.7/5 (31)
Exhibit 15-7
A regression model involving 4 independent variables and a sample of 15 periods resulted in the following sum of squares.
SSR = 165
SSE = 60
-Refer to Exhibit 15-7. The coefficient of determination is
(Multiple Choice)
4.8/5 (28)
A regression model involving 3 independent variables for a sample of 20 periods resulted in the following sum of squares. 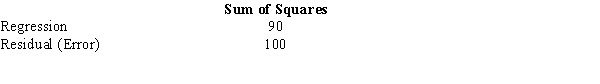 a.Compute the coefficient of determination and fully explain its meaning.
b.At = 0.05 level of significance, test to determine whether or not there is a significant relationship between the independent variables and the dependent variable.
a.Compute the coefficient of determination and fully explain its meaning.
b.At = 0.05 level of significance, test to determine whether or not there is a significant relationship between the independent variables and the dependent variable.
(Essay)
4.8/5 (34)
Exhibit 15-4
a. b. c. d.
-Which equation gives the estimated regression line?
(Multiple Choice)
4.7/5 (34)
Filters
- Essay(0)
- Multiple Choice(0)
- Short Answer(0)
- True False(0)
- Matching(0)