Exam 15: Multiple Regression
Exam 1: Data and Statistics98 Questions
Exam 2: Descriptive Statistics: Tabular and Graphical Displays62 Questions
Exam 3: Descriptive Statistics: Numerical Measures173 Questions
Exam 4: Introduction to Probability138 Questions
Exam 5: Discrete Probability Distributions123 Questions
Exam 6: Continuous Probability Distributions174 Questions
Exam 7: Sampling and Sampling Distributions133 Questions
Exam 8: Interval Estimation137 Questions
Exam 9: Hypothesis Tests148 Questions
Exam 10: Inference About Means and Proportions With Two Populations121 Questions
Exam 11: Inferences About Population Variances90 Questions
Exam 12: Comparing Multiple Proportions, Test of Independence and Goodness of Fit90 Questions
Exam 13: Experimental Design and Analysis of Variance115 Questions
Exam 14: Simple Linear Regression146 Questions
Exam 15: Multiple Regression115 Questions
Exam 16: Regression Analysis: Model Building76 Questions
Exam 17: Time Series Analysis and Forecasting68 Questions
Exam 18: Nonparametric Methods81 Questions
Exam 19: Statistical Methods for Quality Control29 Questions
Exam 20: Index Numbers52 Questions
Exam 21: Decision Analysis on Website65 Questions
Exam 22: Sample Survey on Website63 Questions
Select questions type
Exhibit 15-1
In a regression model involving 44 observations, the following estimated regression equation was obtained. 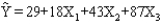 For this model SSR = 600 and SSE = 400.
-Refer to Exhibit 15-1. The coefficient of determination for the above model is
For this model SSR = 600 and SSE = 400.
-Refer to Exhibit 15-1. The coefficient of determination for the above model is
(Multiple Choice)
4.7/5  (39)
(39)
Exhibit 15-5
Below you are given a partial Minitab output based on a sample of 25 observations. 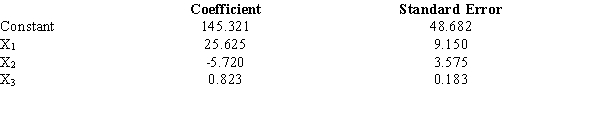 -Refer to Exhibit 15-5. The interpretation of the coefficient on X1 is that
(Multiple Choice)
4.9/5 (37)
Exhibit 15-7
A regression model involving 4 independent variables and a sample of 15 periods resulted in the following sum of squares.
SSR = 165
SSE = 60
-Refer to Exhibit 15-7. The test statistic from the information provided is
(Multiple Choice)
4.7/5 (40)
Exhibit 15-5
Below you are given a partial Minitab output based on a sample of 25 observations.
-Refer to Exhibit 15-5. The t value obtained from the table to test an individual parameter at the 5% level is
(Multiple Choice)
4.7/5 (34)
Exhibit 15-5
Below you are given a partial Minitab output based on a sample of 25 observations.
-Refer to Exhibit 15-5. The estimated regression equation is
(Multiple Choice)
4.8/5 (34)
Exhibit 15-1
In a regression model involving 44 observations, the following estimated regression equation was obtained. For this model SSR = 600 and SSE = 400.
-Refer to Exhibit 15-1. MSR for this model is
(Multiple Choice)
4.7/5 (41)
Exhibit 15-3
In a regression model involving 30 observations, the following estimated regression equation was obtained: 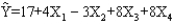 For this model SSR = 700 and SSE = 100.
-Refer to Exhibit 15-3. The conclusion is that the
For this model SSR = 700 and SSE = 100.
-Refer to Exhibit 15-3. The conclusion is that the
(Multiple Choice)
4.8/5 (39)
Exhibit 15-8
The following estimated regression model was developed relating yearly income (Y in $1,000s) of 30 individuals with their age (X1) and their gender (X2) (0 if male and 1 if female). 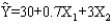 Also provided are SST = 1,200 and SSE = 384.
-Refer to Exhibit 15-8. The yearly income of a 24-year-old female individual is
Also provided are SST = 1,200 and SSE = 384.
-Refer to Exhibit 15-8. The yearly income of a 24-year-old female individual is
(Multiple Choice)
4.9/5 (44)
Exhibit 15-6
Below you are given a partial computer output based on a sample of 16 observations. 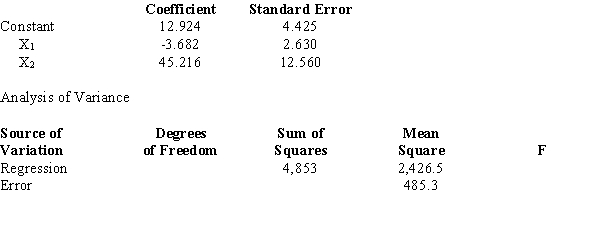 -Refer to Exhibit 15-6. The degrees of freedom for the sum of squares explained by the regression (SSR) are
(Multiple Choice)
4.9/5 (39)
In a multiple regression model, the error term is assumed to
(Multiple Choice)
4.7/5 (34)
The mathematical equation that explains how the dependent variable y is related to several independent variables x1, x2, ......, xp and the error term is
(Multiple Choice)
4.8/5 (27)
Exhibit 15-5
Below you are given a partial Minitab output based on a sample of 25 observations.
-Refer to Exhibit 15-5. We want to test whether the parameter 1 is significant. The test statistic equals
(Multiple Choice)
4.8/5 (33)
In a situation where the dependent variable can assume only one of the two possible discrete values,
(Multiple Choice)
4.8/5 (31)
A student used multiple regression analysis to study how family spending (Y) is influenced by income (X1), family size (X2), and additions to savings (X3). The variables Y, X1, and X3 are measured in thousands of dollars. The following results were obtained. 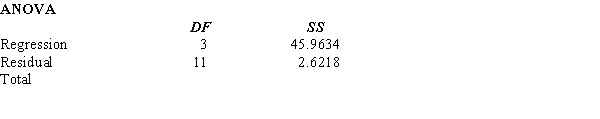
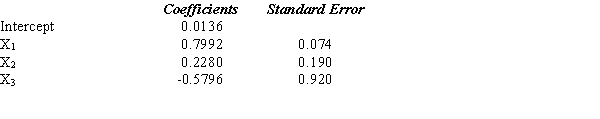 a.Write out the estimated regression equation for the relationship between the variables.
b.Compute R2. What can you say about the strength of this relationship?
c.Carry out a test of whether Y is significantly related to the independent variables. Use a .05 level of significance.
d.Carry out a test to see if X3 and Y are significantly related. Use a .05 level of significance.
a.Write out the estimated regression equation for the relationship between the variables.
b.Compute R2. What can you say about the strength of this relationship?
c.Carry out a test of whether Y is significantly related to the independent variables. Use a .05 level of significance.
d.Carry out a test to see if X3 and Y are significantly related. Use a .05 level of significance.
(Essay)
4.9/5 (32)
A sample of 30 houses that were sold in the last year was taken. The value of the house (Y) was estimated. The independent variables included in the analysis were the number of rooms (X1), the size of the lot (X2), the number of bathrooms (X3), and a dummy variable (X4), which equals 0 if the house does not have a garage and equals 1 otherwise. The following results were obtained: 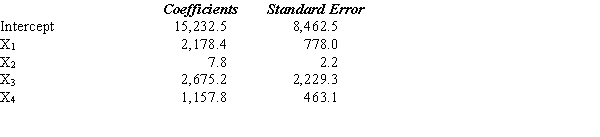
 a. Write out the estimated equation.
b. Interpret the coefficient on the number of rooms (X1).
c. Interpret the coefficient on the dummy variable (X4).
d. What are the degrees of freedom for the sum of squares explained by the regression (SSR) and the sum of squares due to error (SSE)?
e. Test whether or not there is a significant relationship between the value of a house and the independent variables. Use a .05 level of significance. Be sure to state the null and alternative hypotheses.
f. Test the significance of ?1 at the 5% level. Be sure to state the null and alternative hypotheses.
g. Compute the coefficient of determination and interpret its meaning.
h. Estimate the value of a house that has 9 rooms, a lot with an area of 7,500, 2 bathrooms, and 2 garages.
b.Interpret the coefficient on the number of rooms (X1).
c.Interpret the coefficient on the dummy variable (X4).
d.What are the degrees of freedom for the sum of squares explained by the regression (SSR) and the sum of squares due to error (SSE)?
e.Test whether or not there is a significant relationship between the value of a house and the independent variables. Use a .05 level of significance. Be sure to state the null and alternative hypotheses.
a. Write out the estimated equation.
b. Interpret the coefficient on the number of rooms (X1).
c. Interpret the coefficient on the dummy variable (X4).
d. What are the degrees of freedom for the sum of squares explained by the regression (SSR) and the sum of squares due to error (SSE)?
e. Test whether or not there is a significant relationship between the value of a house and the independent variables. Use a .05 level of significance. Be sure to state the null and alternative hypotheses.
f. Test the significance of ?1 at the 5% level. Be sure to state the null and alternative hypotheses.
g. Compute the coefficient of determination and interpret its meaning.
h. Estimate the value of a house that has 9 rooms, a lot with an area of 7,500, 2 bathrooms, and 2 garages.
b.Interpret the coefficient on the number of rooms (X1).
c.Interpret the coefficient on the dummy variable (X4).
d.What are the degrees of freedom for the sum of squares explained by the regression (SSR) and the sum of squares due to error (SSE)?
e.Test whether or not there is a significant relationship between the value of a house and the independent variables. Use a .05 level of significance. Be sure to state the null and alternative hypotheses.
(Essay)
4.7/5 (29)
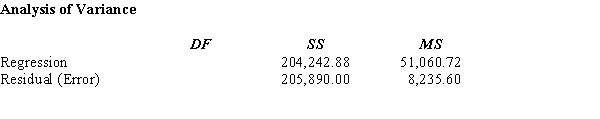
Below you are given a computer output based on a sample of 30 days of the price of a company's stock (Y in dollars), the Dow Jones industrial average (X1), and the stock price of the company's major competitor (X2 in dollars). 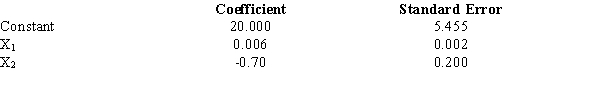 a.Use the output shown above and write an equation that can be used to predict the price of the stock.
b.If the Dow Jones Industrial Average is 10,000 and the price of the competitor is $50, what would you expect the price of the stock to be?
c.At = 0.05, test to determine if the Dow Jones average is a significant variable.
d.At = 0.05, test to determine if the stock price of the major competitor is a significant variable.
a.Use the output shown above and write an equation that can be used to predict the price of the stock.
b.If the Dow Jones Industrial Average is 10,000 and the price of the competitor is $50, what would you expect the price of the stock to be?
c.At = 0.05, test to determine if the Dow Jones average is a significant variable.
d.At = 0.05, test to determine if the stock price of the major competitor is a significant variable.
(Essay)
4.9/5 (29)
Exhibit 15-6
Below you are given a partial computer output based on a sample of 16 observations.
-Refer to Exhibit 15-6. Carry out the test of significance for the parameter 1 at the 1% level. The null hypothesis should be
(Multiple Choice)
4.8/5 (41)
Shown below is a partial computer output from a regression analysis. 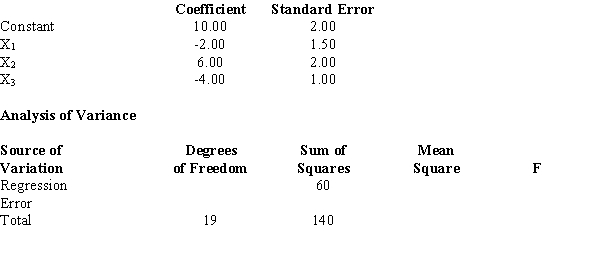 a.Use the above results and write the regression equation.
b.Compute the coefficient of determination and fully interpret its meaning.
c.At = 0.05, test to see if there is a relation between X1 and Y.
d.At = 0.05, test to see if there is a relation between X3 and Y.
e.Is the regression model significant? Perform an F test and let = 0.05.
a.Use the above results and write the regression equation.
b.Compute the coefficient of determination and fully interpret its meaning.
c.At = 0.05, test to see if there is a relation between X1 and Y.
d.At = 0.05, test to see if there is a relation between X3 and Y.
e.Is the regression model significant? Perform an F test and let = 0.05.
(Essay)
4.7/5 (39)
A regression analysis involved 8 independent variables and 99 observations. The critical value of t for testing the significance of each of the independent variable's coefficients will have
(Multiple Choice)
4.8/5 (35)
Filters
- Essay(0)
- Multiple Choice(0)
- Short Answer(0)
- True False(0)
- Matching(0)