Exam 2: Graphical Methods for Describing Data Distributions
Exam 1: Collecting Data in Reasonable Ways56 Questions
Exam 2: Graphical Methods for Describing Data Distributions62 Questions
Exam 3: Numerical Methods for Describing Data Distributions37 Questions
Exam 4: Describing Bivariate Numerical Data70 Questions
Exam 5: Probability55 Questions
Exam 6: Random Variables and Probability Distributions72 Questions
Exam 7: An Overview of Statistical Inference - Learning From Data19 Questions
Exam 8: Sampling Variability and Sampling Distributions35 Questions
Exam 9: Estimating a Population Proportion36 Questions
Exam 10: Asking and Answering Questions About a Population Proportion31 Questions
Exam 11: Asking and Answering Questions About the Difference Between Two Proportions42 Questions
Exam 12: Asking and Answering Questions About a Population Mean51 Questions
Exam 13: Asking and Answering Questions About the Difference Between Two Means46 Questions
Exam 14: Learning From Categorical Data36 Questions
Exam 15: Understanding Relationships - Numerical Data Part 243 Questions
Exam 16: Asking and Answering Questions About More Than Two Means25 Questions
Select questions type
One advantage of histograms is that they may be used for large data sets.
(True/False)
4.9/5  (32)
(32)
Records of the missions of Baja California in the form of baptisms and burial records provide an ideal opportunity to examine the consequences of what is known as the "Colombian Exchange," the movement of organisms large and small between the Old and New Worlds after the appearance of Columbus in 1492. The data below are two time series of the numbers of baptisms at two Central Baja missions, San Jose de Comondu and San Gertrudis. The data are for the decade 1770 - 1779. 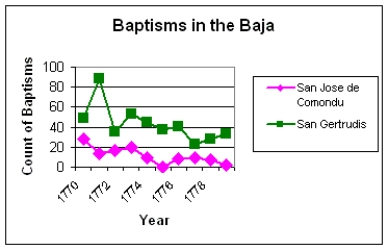 (a)How would you generally describe the trend of baptisms for the two missions over this period? Do the missions appear to show similar trends? Justify your response by appealing to the graph.
(b)One of the influences of the meeting of the Old and New Worlds was the transmission of diseases to the native populations, who had developed no natural immunity from European diseases. If there were anecdotal evidence for an outbreak of disease during this time, which mission and what year seems to be the most likely candidate? Again, justify your response by appealing to the graph.
(a)How would you generally describe the trend of baptisms for the two missions over this period? Do the missions appear to show similar trends? Justify your response by appealing to the graph.
(b)One of the influences of the meeting of the Old and New Worlds was the transmission of diseases to the native populations, who had developed no natural immunity from European diseases. If there were anecdotal evidence for an outbreak of disease during this time, which mission and what year seems to be the most likely candidate? Again, justify your response by appealing to the graph.
(Essay)
4.8/5 (28)
Dotplots work best for small and moderate sized numerical data sets.
(True/False)
4.8/5 (32)
According to the data from fec.gov, since the year 1980, in Texas candidates from the Republican Party won the presidential elections. Following table represents the results of elections since 1984. 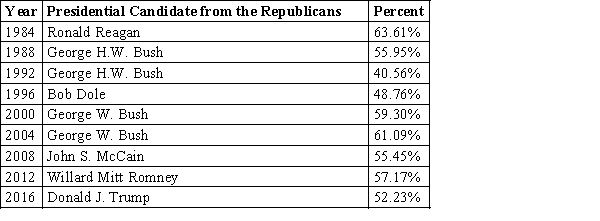 Choose the most appropriate graphical display for the results of elections in Texas.
(Multiple Choice)
4.9/5 (38)
The quantity  often gives a rough estimate of the appropriate number of intervals in a histogram.
(True/False)
4.9/5 (27)
Biologists know that bats have different flight characteristics. Some bats exhibit fast, straight, and long flights; others are moderately slow, and highly maneuverable. The flight capabilities of bats are presumably a function of (a) the characteristics of the bat wings, and (b) the laws of physics. The data presented below are wing weights in grams for certain species of bats from Nicaragua and Costa Rica. Two categories of bat species are represented: fruit-eaters and insect-eaters.
Fruit eaters:
9.9, 11.5, 47.0, 59.6, 18.2, 22.1, 22.9, 15.0, 15.4, 13.3, 38.3, 42.2, 114.3, 105.4, 80.9
Insect eaters:
23.8, 16.1, 4.2, 3.9, 7.5, 3.5, 3.9
(a)Construct two dotplots that will allow you to easily compare the distributions of the wing weights for the two categories of bats, fruit-eaters and insect-eaters.
(b)Write a short paragraph describing the features of the two plots; what do these plots tell you about the differences in wing weight for fruit- and insect-eaters?
(Essay)
4.8/5 (35)
Artificial bird nests have been used extensively when studying predator behavior. The assumption is that predators will find and respond to artificial nests in the same way they do to the natural nests. In a study to test this hypothesis the predation of 27 American Robin (Turdus migratorius) nests and 27 artificial wicker-basket nests were compared. Artificial nests were placed 30m from existing robin's nests in a randomly chosen direction. The natural nests and artificial nests were checked at 5-day intervals, and the number of nests (out of 27) that had been disturbed by predators in the interval was noted. The results are as follows: 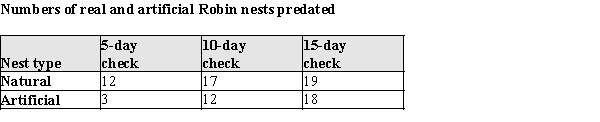
(a)Construct a time series plot for the number of natural nests disturbed by predators. Use the same set of axes to plot the number of artificial nests disturbed by predators.
(b)Does it appear that the artificial and natural nests have the same pattern of predation? Justify your answer by appealing to specific aspects of your plot in part (a).
(Essay)
4.9/5 (33)
Exhibit 2-4
In the article, "Scaling of Mammalian Long Bones: Small and Large Mammals Compared," the average circumferences (distances around) in mm of the humerus, femur, and tibia of different species of mammals were reported. These are the long bones that primarily support the body mass in mammals. Each data value is the mean circumference for the available measures for a single species.
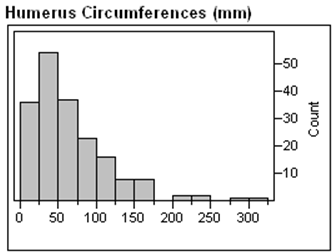
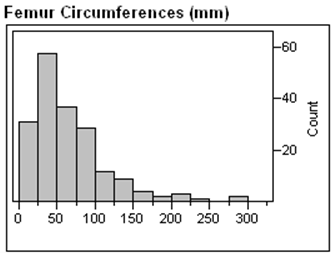
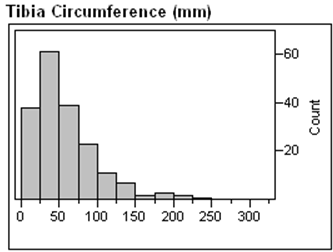 -Refer to Exhibit 2-4.
Biologists speculate that the different amounts of weight might be supported by different sized bones. Based on the histograms, does it seem like one of these bones has on average a greater or lesser circumferences? Explain.
-Refer to Exhibit 2-4.
Biologists speculate that the different amounts of weight might be supported by different sized bones. Based on the histograms, does it seem like one of these bones has on average a greater or lesser circumferences? Explain.
(Essay)
4.7/5 (36)
One interesting aspect of surveys is that the order of the questions can affect the results. This is thought to occur because one question can alter the response to a subsequent question. In 1948 many people in the United States were concerned about the spread of communism as a political and economic philosophy. A survey given that year contained both of the following questions:
1. Do you think the United States should let Communist newspaper reporters from other countries come in here and send back to their papers the news as they see it?
2. Do you think a Communist country like Russia should let American newspaper reporters come in and send back to America the news as they see it?
The following table contains the percentages of the Yes/No answers given by respondents when asked these questions in different orders.
 a) Construct a comparative bar chart for these response percentages.
b) Interpret the results of the 1948 survey. Do you think the order of the questions made a difference in the responses? Explain.
a) Construct a comparative bar chart for these response percentages.
b) Interpret the results of the 1948 survey. Do you think the order of the questions made a difference in the responses? Explain.
(Essay)
4.7/5 (39)
In a survey of 30 working adults who earn less than $6,000 per year, investigators asked about job satisfaction and income. The responses are summarized in the following table:  Construct and sketch a pie chart for these data.
(Essay)
4.8/5 (33)
A survey form solicited the following responses:
I). age of respondent
II) gender of respondent
III). level of job satisfaction (completely dissatisfied/somewhat dissatisfied/somewhat satisfied/completely satisfied)
IV). annual income
Which of the responses represent categorical data?
(Multiple Choice)
4.9/5 (45)
A data set consisting of many observations of a single characteristic is a categorical data set.
(True/False)
4.8/5 (26)
As part of the United States Census, data is also collected on the number of persons in each household. The census data for four decades is summarized below. 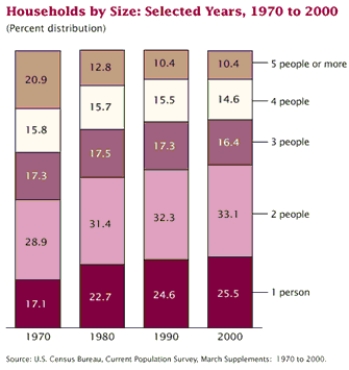 (a)In a few sentences describe how the proportion of households with 4 people has changed from 1970 to 2000.
(b)What size of household appears to have decreased the most from 1970 to 2000?
(a)In a few sentences describe how the proportion of households with 4 people has changed from 1970 to 2000.
(b)What size of household appears to have decreased the most from 1970 to 2000?
(Essay)
4.9/5 (29)
In a study of how college students give directions from maps, 40 Introductory Psychology volunteers, 20 men and 20 women, were given the task of giving directions to another. Observations were made of subjects' direction-giving behavior in the experiment:
(a)whether the map was available, or the directions were given from memory,
(b)the sex of the direction giver,
(c)the distances given as part of the directions,
(d)the number of times directions such as North, Southwest, etc. were used, and
(e)the frequency of errors in the directions
For each of the variables in this experiment, determine whether it is categorical or numerical. For each numerical variable, determine whether it is discrete or continuous:
(a)whether the map was available, or the directions were given from memory
(b)the sex of the direction giver
(c)the distances given as part of the directions
(d)the number of times directions such as North, Southwest, etc. were used
(e)Frequency of errors in the directions
(Essay)
4.8/5 (34)
Exhibit 2-3
There has been a recent increase in the popularity of caffeine-containing "energy drinks" or "functional beverages"--substances that are considered to be food that may provide some health benefit. However, caffeine in these drinks presents an important health concern, especially for women of childbearing age. Studies have shown an increased risk of spontaneous abortion and low birth weight children to women consuming more than 150 mg/day of caffeine. In a recent study, eighteen 12-oz servings of different brands of carbonated sodas were analyzed to ascertain their caffeine content, with the results presented below. The data are in mg/12-oz serving; if no caffeine was detected, this is reported as "* mg/serving."
Caffeine (mg) in 12 oz servings of Carbonated Sodas
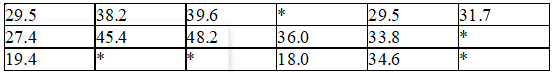 -Refer to Exhibit 2-3.
a)Construct a comparative (back to back) stem & leaf plot for the container vs. fountain amounts of caffeine. (Do not use the data for carbonated sodas where caffeine was not detected.) Describe how the two distributions compare.
(b)What do you think might explain the differences between the two distributions?
-Refer to Exhibit 2-3.
a)Construct a comparative (back to back) stem & leaf plot for the container vs. fountain amounts of caffeine. (Do not use the data for carbonated sodas where caffeine was not detected.) Describe how the two distributions compare.
(b)What do you think might explain the differences between the two distributions?
(Essay)
4.9/5 (28)
In birds, the muscles that pull the wing down, and thus cause the actual flight, are the "large pectorals." In the article, "Dimensional Relationships for Flying Animals," the author reports the following pectoral muscle weight in grams for birds of prey (Rapaces diurnes voiliers.)958, 715, 299, 476, 223, 270, 194, 226, 113.5, 79.8,
149, 84.2, 73.8, 53.8, 36, 48, 151
(a)Construct a stem and leaf plot of these data.
(b)In a few sentences, describe the distribution of the pectoral muscle weights.
(Essay)
4.8/5 (30)
A data set is discrete if the possible values are isolated points on the number line.
(True/False)
4.8/5 (29)
Filters
- Essay(0)
- Multiple Choice(0)
- Short Answer(0)
- True False(0)
- Matching(0)