Exam 2: Graphical Methods for Describing Data Distributions
Exam 1: Collecting Data in Reasonable Ways56 Questions
Exam 2: Graphical Methods for Describing Data Distributions62 Questions
Exam 3: Numerical Methods for Describing Data Distributions37 Questions
Exam 4: Describing Bivariate Numerical Data70 Questions
Exam 5: Probability55 Questions
Exam 6: Random Variables and Probability Distributions72 Questions
Exam 7: An Overview of Statistical Inference - Learning From Data19 Questions
Exam 8: Sampling Variability and Sampling Distributions35 Questions
Exam 9: Estimating a Population Proportion36 Questions
Exam 10: Asking and Answering Questions About a Population Proportion31 Questions
Exam 11: Asking and Answering Questions About the Difference Between Two Proportions42 Questions
Exam 12: Asking and Answering Questions About a Population Mean51 Questions
Exam 13: Asking and Answering Questions About the Difference Between Two Means46 Questions
Exam 14: Learning From Categorical Data36 Questions
Exam 15: Understanding Relationships - Numerical Data Part 243 Questions
Exam 16: Asking and Answering Questions About More Than Two Means25 Questions
Select questions type
In a psychological study of distance perception, introductory psychology class volunteers were given 5, 10, or 15 extra credit points depending on their level of participation in the experiment. They walked along paths laid out along hallways in the psychology building, and were asked to judge the distance they had walked. Each path distance was between 100 and 200 feet in length, and contained from two to seven 90 degree turns. The investigators also kept track of class standing (freshman, sophomore, junior, or senior). For each of the variables in this study, determine whether it is categorical or numerical. For each numerical variable, determine whether it is discrete or continuous:
(a)The true length of the path
(b)The amount of credit given to the volunteers
(c)The length of the path as judged by the students
(d)The number of 90 degree turns
(e)Class standing
(Essay)
4.9/5  (34)
(34)
The density of a class can be calculated by multiplying the relative frequency of the class times the class width.
(True/False)
4.9/5 (35)
Artificial nest have often been used when biologists study predation on birds. It is usually assumed that predators will respond to artificial nests in the same way they do to real birds' nests. A recent experiment was performed to check this assumption for predators of the American robin (Turdus migratorius) by comparing the egg loss in three experimental treatments: (1) natural robin's nests, (2) artificial wicker-basket nests placed 30 meters in a random direction from natural robin's nests, and (3) artificial wicker-basket nests placed in a 180 m by 240 m grid around robin's nests. The data below are cumulative counts of eggs predated (stolen or broken and eaten) at 5, 10, and 15 day points of the experiment. 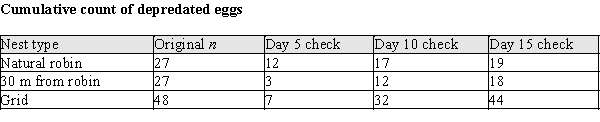
(a)Construct a bar chart to display the cumulative counts for the natural robin nests at their 5-, 10-, and 15-day checks.
(b)Fill in the relative frequency distribution (table) representing the cumulative counts for the artificial nests in the grid. (Do not convert the table to a graph.)
(a)Construct a bar chart to display the cumulative counts for the natural robin nests at their 5-, 10-, and 15-day checks.
(b)Fill in the relative frequency distribution (table) representing the cumulative counts for the artificial nests in the grid. (Do not convert the table to a graph.) 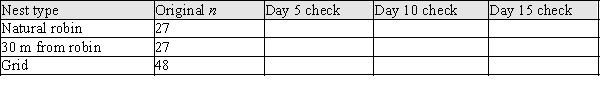
(Essay)
4.8/5 (44)
A statistics company made a survey about using smartphones or regular cell phones versus the age group in one U.S. State. For each of the six age groups (younger than 18 years old, 18- to 24 years old, 25- to 39 years old, 40- to 59 years old, 60- to 69 years old, 70 years old and older) one was picked up hundred people were selected, which possessed either a smartphone, or a regular cell phone, or no possessed a cell phone at all.
Choose the more most appropriate graphical display for the statistical survey described above.
(Multiple Choice)
5.0/5 (31)
Iowa is an agricultural state with a large number of rivers. The use of chemical pesticides and increasing size of livestock herds has created a concern for the water quality in the state. A researcher recently surveyed the rivers of Iowa and analyzed the concentrations of certain chemicals at different locations in the watersheds of Iowa. The cumulative relative frequency plot below displays the distribution of Nitrogen concentrations along the Skunk River. 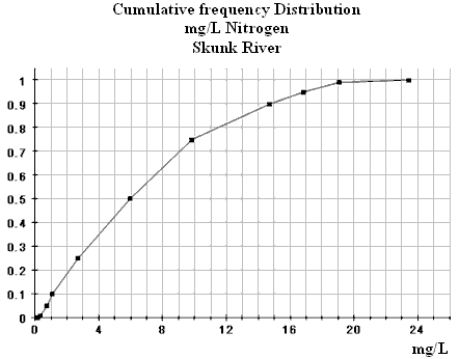 (a)Approximately what percent of the Nitrogen concentration measurements are less than 10 mg/L?
(b)Approximately what percent of the Nitrogen concentration measurements are 12 mg/L or more?
(c)50% of the Nitrogen concentration measurements lie below what approximate value?
(a)Approximately what percent of the Nitrogen concentration measurements are less than 10 mg/L?
(b)Approximately what percent of the Nitrogen concentration measurements are 12 mg/L or more?
(c)50% of the Nitrogen concentration measurements lie below what approximate value?
(Essay)
4.9/5 (31)
In a scatter plot, both the horizontal and vertical axes must be set at zero.
(True/False)
4.7/5 (37)
An experiment was performed to determine which brand of comparably priced light bulbs, A or B, lasts longer on average. Ten bulbs of each brand were tested, and their lifetimes recorded in hours. The data are shown below:
Bulb A: 88, 97, 110, 122, 128, 129, 135, 141, 150, 165
Bulb B: 23, 55, 93, 106, 111, 115, 123, 128, 153, 171
(a)Display these data using a comparative (back-to-back) stemplot.
(b)What are the differences and similarities in the lifetime distributions for the two samples?
(c)If your preference for brand A or B must be determined from the information in parts (a) and (b), which brand would you buy? Explain your choice using appropriate statistical terminology.
(Essay)
4.9/5 (30)
A data set is multivariate if it consists only of numeric variables.
(True/False)
4.7/5 (35)
Professor wants to identify the relationship between the test scores in her class and the number of hours spent by student preparing to the test. She collected information about preparing time and the test scores in the table below. 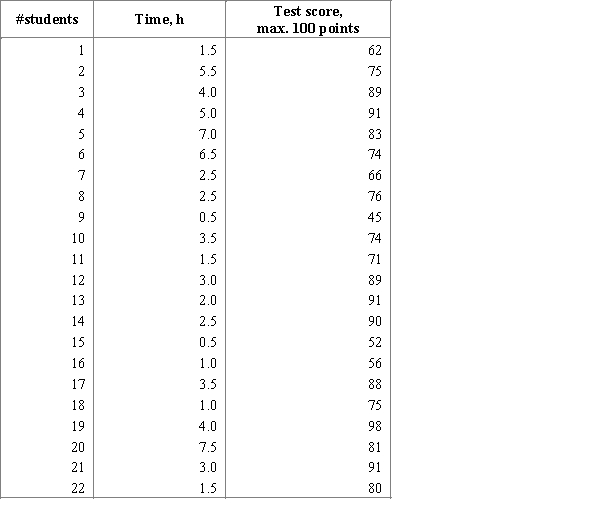 Choose the most appropriate graphical display for professor to see the relationship between preparing time and the test scores.
(Multiple Choice)
4.9/5 (31)
If the upper tail of a distribution stretches out farther than the lower tail, the distribution is negatively skewed.
(True/False)
4.8/5 (37)
Which of the following stem and leaf plots corresponds a data distribution that is positively (right) skewed? I. 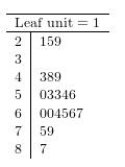 II.
II.  III.
III. 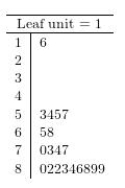
(Multiple Choice)
4.8/5 (37)
Iowa is an agricultural state with a large number of rivers. The use of chemical pesticides and increasing size of livestock herds has created a concern for the water quality in the state. A researcher recently surveyed the rivers of Iowa and analyzed the concentrations of certain chemicals at different locations in the watersheds of Iowa. The cumulative relative frequency plot below displays the distribution of Nitrogen concentrations along the Cedar River. 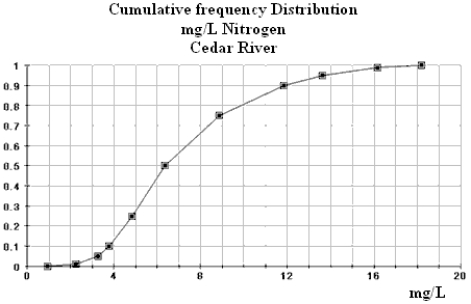 (a)Approximately what percent of the Nitrogen concentration measurements are less than 10 mg/L?
(b)Approximately what percent of the Nitrogen concentration measurements are 12 mg/L or more?
(c)50% of the Nitrogen concentration measurements lie below what approximate value?
(a)Approximately what percent of the Nitrogen concentration measurements are less than 10 mg/L?
(b)Approximately what percent of the Nitrogen concentration measurements are 12 mg/L or more?
(c)50% of the Nitrogen concentration measurements lie below what approximate value?
(Essay)
4.8/5 (40)
Bat characteristics
Biologists know that bats have different flight characteristics. Some bats exhibit fast, straight, and long flights; others are moderately slow, and highly maneuverable. The flight capabilities of bats are presumably a function of (a) the characteristics of the bat wings, and (b) the laws of physics. The data presented below are wing spans in centimeters for certain species of bats from Nicaragua and Costa Rica. Two categories of bat species are represented: fruit-eaters and insect-eaters.
Fruit eaters:
25.2, 27.2, 42.0, 44.8, 31.3, 32.5, 32.0, 28.1, 30.7, 27.0, 41.1, 41.6, 58.4, 58.7, 53.9
Insect eaters:
32.8, 27.4, 21.0, 23.9, 27.5, 22.4, 18.7
(a)Construct two dotplots that will allow you to easily compare the distributions of the wing spans for the two categories of bats, fruit-eaters and insect-eaters.
(b)Write a short paragraph describing the features of the two plots; what do these plots tell you about the differences in wing span for fruit- and insect-eaters?
(Essay)
4.8/5 (46)
Exhibit 2-3
There has been a recent increase in the popularity of caffeine-containing "energy drinks" or "functional beverages"--substances that are considered to be food that may provide some health benefit. However, caffeine in these drinks presents an important health concern, especially for women of childbearing age. Studies have shown an increased risk of spontaneous abortion and low birth weight children to women consuming more than 150 mg/day of caffeine. In a recent study, eighteen 12-oz servings of different brands of carbonated sodas were analyzed to ascertain their caffeine content, with the results presented below. The data are in mg/12-oz serving; if no caffeine was detected, this is reported as "* mg/serving."
Caffeine (mg) in 12 oz servings of Carbonated Sodas
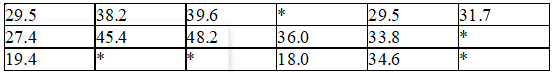 -Refer to Exhibit 2-3.
(a)Construct a stem and leaf plot of the caffeine-content for the detected amounts of caffeine.
(b)In a few sentences, describe the distribution of the caffeine-content. How would your description change if the "none detected" were treated as 0.0 mg/serving?
-Refer to Exhibit 2-3.
(a)Construct a stem and leaf plot of the caffeine-content for the detected amounts of caffeine.
(b)In a few sentences, describe the distribution of the caffeine-content. How would your description change if the "none detected" were treated as 0.0 mg/serving?
(Essay)
4.9/5 (35)
The annual household incomes, in thousands of dollars, for 500 households in a small community are summarized in the histogram below. 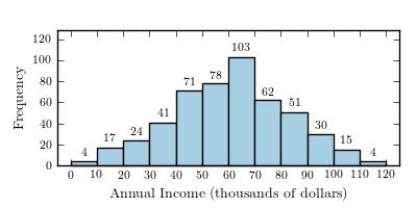 Which of the following values best describes a typical household income for this community?
(Multiple Choice)
4.8/5 (33)
A survey asked adult respondents how dependent they were on various electronic devices. The accompanying table summarizes the responses. 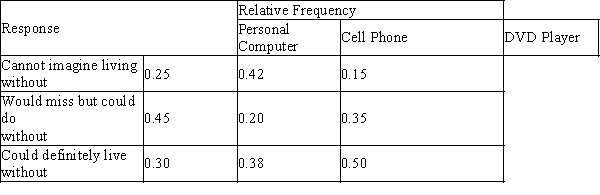 Select a comparative bar chart that shows the distributions of responses for the three different technologies.
(Multiple Choice)
4.7/5 (32)
According to the stem-and-leaf display below, how many times does the number 58 appear in the data set? 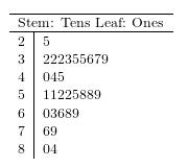
(Multiple Choice)
4.8/5 (41)
The pie chart below summarizes the results of a survey of 300 randomly selected students at a particular high school. The investigators asked about soft drink preferences at a local high school. 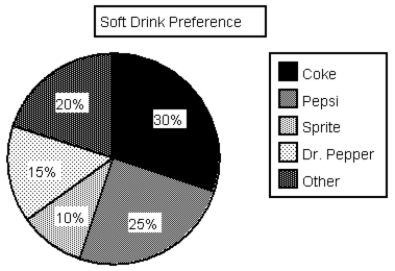 (a)How many out of the 300 students indicated a preference for Dr. Pepper?
(b)Write a few sentences summarizing the soft drink preference for this sample of students.
(c)Using the information in the pie chart above, sketch a relative frequency bar chart for these data.
(a)How many out of the 300 students indicated a preference for Dr. Pepper?
(b)Write a few sentences summarizing the soft drink preference for this sample of students.
(c)Using the information in the pie chart above, sketch a relative frequency bar chart for these data.
(Essay)
4.7/5 (31)
A statewide survey released by the University of Iowa Injury Prevention Research Center was designed to assess compliance with Iowa seatbelt law. The table below shows the results for 5 Iowa cities. 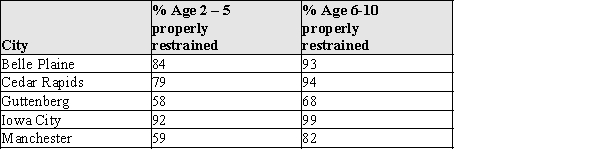
(a)Display these data in a comparative bar chart so that the different ages can be compared for the different cities.
(b)Write a brief description of the differences and similarities in the patterns you observe in your bar chart for part (a).
(a)Display these data in a comparative bar chart so that the different ages can be compared for the different cities.
(b)Write a brief description of the differences and similarities in the patterns you observe in your bar chart for part (a).
(Essay)
4.8/5 (30)
One of the "media messages" sent by television is that appearance is a very important aspect of one's being. These messages are thought to spur young women to have unrealistic expectations about beauty, thus spending billions of dollars on cosmetics and toiletries. Some of these messages were studied during the 1999-2000 prime-time television season, when investigators kept track of the "appearance" comments. Some of their data, comments by males, classified by gender of recipient and type of appearance comment, is reproduced in the table below. 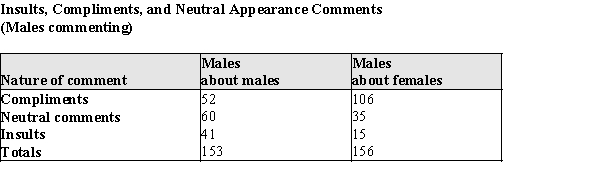
(a)Construct two pie charts, one for comments about males, one for comments about females, to summarize the data above.
(b)Using the information in the table above and the pie charts in part (a), display the given information in a comparative bar chart.
In the same study of appearance comments mentioned, comments by females were tabulated. That data appears below:
(a)Construct two pie charts, one for comments about males, one for comments about females, to summarize the data above.
(b)Using the information in the table above and the pie charts in part (a), display the given information in a comparative bar chart.
In the same study of appearance comments mentioned, comments by females were tabulated. That data appears below: 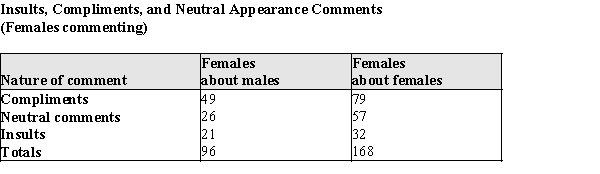
(c)Display these data in a segmented bar chart to compare the distribution of comments in these two samples.
(d)Based on the information from the graphs in parts (a) - (c), how do the distributions differ when men rather than women are making the comments, and how do they differ when men rather than women are the recipients of the comments?
(Essay)
4.9/5 (37)
Filters
- Essay(0)
- Multiple Choice(0)
- Short Answer(0)
- True False(0)
- Matching(0)