Exam 2: Methods for Describing Sets of Data
Exam 1: Statistics, Data, and Statistical Thinking77 Questions
Exam 2: Methods for Describing Sets of Data187 Questions
Exam 3: Probability284 Questions
Exam 4: Discrete Random Variables134 Questions
Exam 5: Continuous Random Variables138 Questions
Exam 6: Sampling Distributions52 Questions
Exam 7: Inferences Based on a Single Sample: Estimation With Confidence Intervals125 Questions
Exam 8: Inferences Based on a Single144 Questions
Exam 9: Inferences Based on Two Samples: Confidence Intervals and Tests of Hypotheses100 Questions
Exam 10: Analysis of Variance: Comparing More Than Two Means91 Questions
Exam 11: Simple Linear Regression113 Questions
Exam 12: Multiple Regression and Model Building131 Questions
Exam 13: Categorical Data Analysis60 Questions
Exam 14: Nonparametric Statistics Available Online87 Questions
Select questions type
Percentile rankings are of practical value only with large data sets.
(True/False)
4.9/5  (33)
(33)
The sample variance is always greater than the sample standard deviation.
(True/False)
4.9/5 (42)
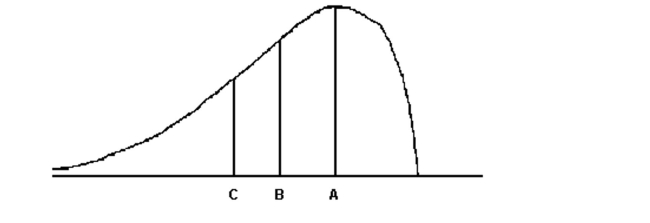 For the distribution drawn here, identify the mean, median, and mode.
(Multiple Choice)
4.9/5 (31)
The mean of a data set is 18 , and the sample standard deviation s is 2 . Explain what the interval (12,24) represents.
(Essay)
4.8/5 (39)
The scatterplot below shows a negative relationship between two variables. 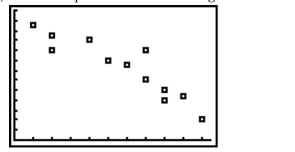
(True/False)
4.8/5 (31)
At the U.S. Open Tennis Championship a statistician keeps track of every serve that a player hits during the tournament. The statistician reported that the mean serve speed of a particular player
Was 96 miles per hour (mph)and the standard deviation of the serve speeds was 9 mph. Using the
Z-score approach for detecting outliers, which of the following serve speeds would represent
Outliers in the distribution of the playerʹs serve speeds?
Speeds: 65 mph, 105 mph, and 114 mph
(Multiple Choice)
4.7/5 (42)
A study was designed to investigate the effects of two variables -(1)a studentʹs level of
mathematical anxiety and (2)teaching method - on a studentʹs achievement in a
mathematics course. Students who had a low level of mathematical anxiety were taught
using the traditional expository method. These students obtained a mean score of 300 and
a standard deviation of 50 on a standardized test. Find and interpret the z-score of a
student who scored 440 on the standardized test.
(Essay)
4.8/5 (34)
Filters
- Essay(0)
- Multiple Choice(0)
- Short Answer(0)
- True False(0)
- Matching(0)