Exam 2: Methods for Describing Sets of Data
Exam 1: Statistics, Data, and Statistical Thinking77 Questions
Exam 2: Methods for Describing Sets of Data187 Questions
Exam 3: Probability284 Questions
Exam 4: Discrete Random Variables134 Questions
Exam 5: Continuous Random Variables138 Questions
Exam 6: Sampling Distributions52 Questions
Exam 7: Inferences Based on a Single Sample: Estimation With Confidence Intervals125 Questions
Exam 8: Inferences Based on a Single144 Questions
Exam 9: Inferences Based on Two Samples: Confidence Intervals and Tests of Hypotheses100 Questions
Exam 10: Analysis of Variance: Comparing More Than Two Means91 Questions
Exam 11: Simple Linear Regression113 Questions
Exam 12: Multiple Regression and Model Building131 Questions
Exam 13: Categorical Data Analysis60 Questions
Exam 14: Nonparametric Statistics Available Online87 Questions
Select questions type
Test scores for a history class had a mean of 79 with a standard deviation of 4.5. Test
scores for a physics class had a mean of 69 with a standard deviation of 3.7. One student
earned a 59 on the history test and a 98 on the physics test. Calculate the z-score for each
test. On which test did the student perform better?
(Essay)
4.8/5  (40)
(40)
The speeds of the fastballs thrown by major league baseball pitchers were measured by radar gun. The mean speed was 87 miles per hour. The standard deviation of the speeds was 5 mph. Which of
The following speeds would be classified as an outlier?
(Multiple Choice)
4.9/5 (40)
Fill in the blank. __________ gives us a method of interpreting the standard deviation of any data set, regardless of the shape of the distribution.
(Multiple Choice)
4.8/5 (35)
Your teacher announces that the scores on a test have a mean of 83 points with a standard
deviation of 4 points, so it is reasonable to expect that you scored at least 70 on the test.
(True/False)
4.8/5 (41)
In a summary of recent real estate sales, the median home price is given as $325,000. What
percentile corresponds to a home price of $325,000?
(Short Answer)
4.9/5 (32)
The range is an insensitive measure of data variation for large data sets because two data sets can
have the same range but be vastly different with respect to data variation.
(True/False)
4.8/5 (40)
The amount spent on textbooks for the fall term was recorded for a sample of five hundred university students. The mean expenditure was calculated to be $500 and the median expenditure
Was calculated to be $425. Which of the following interpretations of the median is correct?
(Multiple Choice)
4.9/5 (41)
Box plots are used to detect outliers in qualitative data sets, while z-scores are used to detect
outliers in quantitative data sets.
(True/False)
4.8/5 (31)
Explain how using a scale break on the vertical axis of a histogram can be misleading.
(Essay)
4.7/5 (41)
According to the empirical rule, z-scores of less than -3 or greater than 3 occur very infrequently
for data from a mounded and symmetric distribution
(True/False)
4.7/5 (40)
A dot plot of the speeds of a sample of 50 cars passing a policeman with a radar gun is shown below. 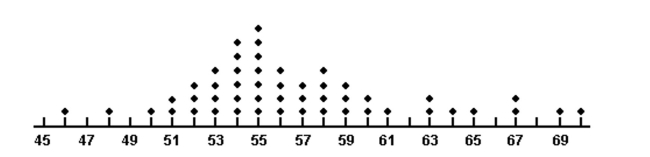 What proportion of the motorists were driving above the posted speed limit of 55 miles per hour?
(Multiple Choice)
4.7/5 (36)
The amount of television viewed by todayʹs youth is of primary concern to Parents Against Watching Television (PAWT). 300 parents of elementary school-aged children were asked to
Estimate the number of hours per week that their child watches television. The mean and the
Standard deviation for their responses were 19 and 2, respectively. PAWT constructed a
Stem-and-leaf display for the data that showed that the distribution of times was a symmetric,
Mound-shaped distribution. Give an interval where you believe approximately 95% of the
Television viewing times fell in the distribution.
(Multiple Choice)
4.8/5 (29)
The amount spent on textbooks for the fall term was recorded for a sample of five hundred university students. The mean expenditure was calculated to be $500 and the standard deviation of
The expenditures was calculated to be $100. Suppose a randomly selected student reported that
Their textbook expenditure was $700. Calculate the z-score for this studentʹs textbook expenditure.
(Multiple Choice)
4.8/5 (47)
Which is expressed in the same units as the original data, the variance or the standard
deviation?
(Short Answer)
4.9/5 (38)
Many firms use on-the-job training to teach their employees computer programming. Suppose you work in the personnel department of a firm that just finished training a group of its employees
To program, and you have been requested to review the performance of one of the trainees on the
Final test that was given to all trainees. The mean and standard deviation of the test scores are 84
And 4, respectively, and the distribution of scores is mound-shaped and symmetric. What
Percentage of test-takers scored better than a trainee who scored 72?
(Multiple Choice)
4.9/5 (45)
The top speeds for a sample of five new automobiles are listed below. Calculate the standard deviation of the speeds. Round to four decimal places.
195, 135, 200, 190, 150
(Multiple Choice)
4.8/5 (35)
The amount of television viewed by todayʹs youth is of primary concern to Parents
Against Watching Television (PAWT). Three hundred parents of elementary school-aged
children were asked to estimate the number of hours per week that their child watches
television. The upper quartile for the distribution was given as 17 hours. Interpret this
value.
(Essay)
4.8/5 (34)
The table shows the number of each type of car sold in June. Car Number compact 7,204 sedan 9,089 small SUV 20,418 large SUV 13,691 minivan 15,837 truck 15,350 Total 81,589 a. Construct a relative frequency table for the car sales.
b. Construct a Pareto diagram for the car sales using the class percentages as the heights
of the bars.
(Essay)
4.8/5 (35)
A shoe retailer keeps track of all types of information about sales of newly released shoe styles. One newly released style was marketed to tall people. Listed below are the shoe sizes of 12
Randomly selected customers who purchased the new style. Find the mode of the shoe sizes.
9 11 12 11 8 10 8 11 10 11 9 10
(Multiple Choice)
4.9/5 (33)
The output below displays the mean and median for the state high school dropout rates in year 1 and in year 5. Year 1 Year 5 N 51 51 MEAN 28.12 26.94 MEDIAN 27.11 25.51 Interpret the year 5 median dropout rate of 25.51.
(Multiple Choice)
4.8/5 (35)
Filters
- Essay(0)
- Multiple Choice(0)
- Short Answer(0)
- True False(0)
- Matching(0)