Exam 2: Methods for Describing Sets of Data
Exam 1: Statistics, Data, and Statistical Thinking77 Questions
Exam 2: Methods for Describing Sets of Data187 Questions
Exam 3: Probability284 Questions
Exam 4: Discrete Random Variables134 Questions
Exam 5: Continuous Random Variables138 Questions
Exam 6: Sampling Distributions52 Questions
Exam 7: Inferences Based on a Single Sample: Estimation With Confidence Intervals125 Questions
Exam 8: Inferences Based on a Single144 Questions
Exam 9: Inferences Based on Two Samples: Confidence Intervals and Tests of Hypotheses100 Questions
Exam 10: Analysis of Variance: Comparing More Than Two Means91 Questions
Exam 11: Simple Linear Regression113 Questions
Exam 12: Multiple Regression and Model Building131 Questions
Exam 13: Categorical Data Analysis60 Questions
Exam 14: Nonparametric Statistics Available Online87 Questions
Select questions type
A study was designed to investigate the effects of two variables - (1)a studentʹs level of mathematical anxiety and (2)teaching method - on a studentʹs achievement in a mathematics
Course. Students who had a low level of mathematical anxiety were taught using the traditional
Expository method. These students obtained a mean score of 420 with a standard deviation of 20
On a standardized test. Assuming a mound-shaped and symmetric distribution, what percentage
Of scores exceeded 380?
(Multiple Choice)
4.8/5  (35)
(35)
The scores for a statistics test are as follows: 73 76 88 77 90 92 98 85 89 89
79 79 50 70 85 61 85 74 18 80 Compute the mean score.
(Multiple Choice)
4.9/5 (37)
One of the questions posed to a sample of 286 incoming freshmen at a large public university was, ʺDo you have any tattoos?ʺ Their responses are shown below in the pie chart. Please note that the
Values shown represent the number of responses in each category. 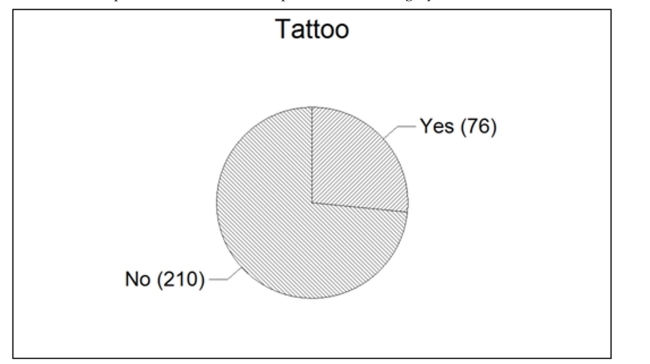 Based on the responses shown in the pie chart, what percentage of the freshmen responded with
ʺYes?ʺ
Based on the responses shown in the pie chart, what percentage of the freshmen responded with
ʺYes?ʺ
(Multiple Choice)
4.8/5 (32)
Many firms use on-the-job training to teach their employees computer programming.
Suppose you work in the personnel department of a firm that just finished training a
group of its employees to program, and you have been requested to review the
performance of one of the trainees on the final test that was given to all trainees. The mean
and standard deviation of the test scores are 85 and 3, respectively, and the distribution of
scores is mound-shaped and symmetric. If a firm wanted to give the best 2.5% of the
trainees a big promotion, what test score would be used to identify the trainees in
question?
(Essay)
4.8/5 (36)
The range of scores on a statistics test was 42. The lowest score was 57. What was the highest score?
(Multiple Choice)
4.8/5 (39)
Given the sample variance of a distribution, explain how to find the standard deviation.
(Essay)
4.9/5 (33)
What characteristic of a Pareto diagram distinguishes it from other bar graphs?
(Essay)
4.8/5 (40)
A sample of professional golfers was taken and their driving distance (measured as the average distance as their drive off the tee)and driving accuracy (measured as the percentage of fairways
That their drives landed in)were recorded. A scatterplot of the variables is shown below. 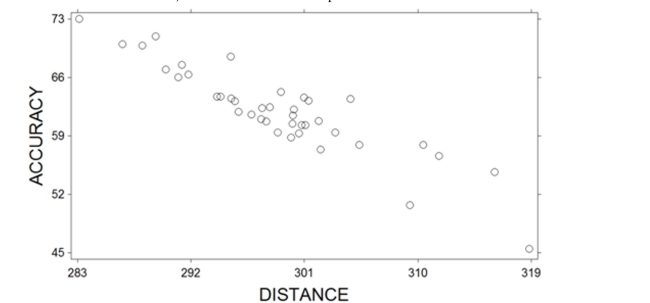 What relationship do these two variables exhibit?
(Multiple Choice)
4.7/5 (36)
The amount of time workers spend commuting to their jobs each day in a large metropolitan city has a mean of 70 minutes and a standard deviation of 20 minutes. Assuming the distribution of
Commuting times is known to be moundshaped and symmetric, what percentage of these
Commuting times are between 50 and 110 minutes?
(Multiple Choice)
4.8/5 (28)
A radio station claims that the amount of advertising each hour has an a mean of 16
minutes and a standard deviation of 1.3 minutes. You listen to the radio station for 1 hour
and observe that the amount of advertising time is 13.66 minutes. Based on your
observation, what would you infer about the radio stationʹs claim?
(Essay)
4.9/5 (40)
At the U.S. Open Tennis Championship a statistician keeps track of every serve that a
player hits during the tournament. The statistician reported that the mean serve speed of a
particular player was 98 miles per hour (mph)and the standard deviation of the serve
speeds was 9 mph. Assume that the statistician also gave us the information that the
distribution of serve speeds was mound-shaped and symmetric. Find the percentage of
serves that were hit faster than 80 mph.
(Essay)
4.9/5 (38)
An outlier may be caused by accidentally including the height of a six-year-old boy in a set of
data representing the heights of 12-year-old boys.
(True/False)
4.7/5 (41)
The payroll amounts for all teams in an international hockey league are shown below using a graphical technique from chapter 2 of the text. How many of the hockey team payrolls exceeded
$20 million (Note: Assume that no payroll was exactly $20 million)? 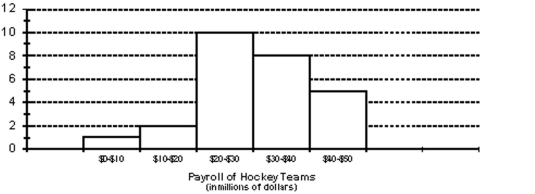
(Multiple Choice)
4.8/5 (29)
The data below show the types of medals won by athletes representing the United States
in the Winter Olympics. gold gold silver gold bronze silver silver bronze gold silver silver bronze silver gold gold silver silver bronze bronze gold silver gold gold bronze bronze
a. Construct a frequency table for the data.
b. Construct a relative frequency table for the data.
c. Construct a frequency bar graph for the data.
(Essay)
4.8/5 (38)
The data show the total number of medals (gold, silver, and bronze)won by each country
winning at least one gold medal in the Winter Olympics.  a. Complete the class frequency table for the data.
Total Medals Frequency 1-5 6-10 11-15 16-20 21-25 26-30
b. Using the classes from the frequency table, construct a histogram for the data.
a. Complete the class frequency table for the data.
Total Medals Frequency 1-5 6-10 11-15 16-20 21-25 26-30
b. Using the classes from the frequency table, construct a histogram for the data.
(Essay)
4.9/5 (40)
Many firms use on-the-job training to teach their employees computer programming. Suppose you work in the personnel department of a firm that just finished training a group of its employees
To program, and you have been requested to review the performance of one of the trainees on the
Final test that was given to all trainees. The mean of the test scores is 75. Additional information
Indicated that the median of the test scores was 85. What type of distribution most likely describes
The shape of the test scores?
(Multiple Choice)
5.0/5 (29)
The calculator screens summarize a data set.  a. Identify the mean and the median.
b. Based only on the mean and the median, do you expect that the data set is skewed to
the right, symmetric, or skewed to the left? Explain.
a. Identify the mean and the median.
b. Based only on the mean and the median, do you expect that the data set is skewed to
the right, symmetric, or skewed to the left? Explain.
(Essay)
4.8/5 (37)
The following data represent the scores of 50 students on a statistics exam. The mean
score is 80.02, and the standard deviation is 11.9. 39 51 59 63 66 68 68 69 70 71
71 71 73 74 76 76 76 77 78 79
79 79 79 80 80 82 83 83 83 85
85 86 86 88 88 88 88 89 89 89
90 90 91 91 92 95 96 97 97 98 Find the z-scores for the highest and lowest exam scores.
(Short Answer)
5.0/5 (41)
Parking at a university has become a problem. University administrators are interested in
determining the average time it takes a student to find a parking spot. An administrator
inconspicuously followed 190 students and recorded how long it took each of them to find
a parking spot. The times had a distribution that was skewed to the right. Based on this
information, discuss the relationship between the mean and the median for the 190 times
collected.
(Essay)
4.8/5 (37)
Which measures variability about the mean, the range or the standard deviation?
(Short Answer)
4.8/5 (30)
Filters
- Essay(0)
- Multiple Choice(0)
- Short Answer(0)
- True False(0)
- Matching(0)