Exam 2: Methods for Describing Sets of Data
Exam 1: Statistics, Data, and Statistical Thinking77 Questions
Exam 2: Methods for Describing Sets of Data187 Questions
Exam 3: Probability284 Questions
Exam 4: Discrete Random Variables134 Questions
Exam 5: Continuous Random Variables138 Questions
Exam 6: Sampling Distributions52 Questions
Exam 7: Inferences Based on a Single Sample: Estimation With Confidence Intervals125 Questions
Exam 8: Inferences Based on a Single144 Questions
Exam 9: Inferences Based on Two Samples: Confidence Intervals and Tests of Hypotheses100 Questions
Exam 10: Analysis of Variance: Comparing More Than Two Means91 Questions
Exam 11: Simple Linear Regression113 Questions
Exam 12: Multiple Regression and Model Building131 Questions
Exam 13: Categorical Data Analysis60 Questions
Exam 14: Nonparametric Statistics Available Online87 Questions
Select questions type
The mean and the median are useful measures of central tendency for both qualitative and
quantitative data.
(True/False)
4.7/5  (38)
(38)
A histogram can be constructed using either class frequencies or class relative frequencies as the
heights of the bars.
(True/False)
4.7/5 (36)
What class percentage corresponds to a class relative frequency of .37?
(Multiple Choice)
4.8/5 (38)
Which of the following is not a measure of central tendency?
(Multiple Choice)
4.9/5 (39)
Various state and national automobile associations regularly survey gasoline stations to
determine the current retail price of gasoline. Suppose one such national association
contacts 200 stations in the United States to determine the price of regular unleaded
gasoline at each station. In the context of this problem, define the following descriptive
measures:
(Essay)
4.9/5 (38)
A retail storeʹs customer satisfaction rating is at the 88th percentile. What percentage of
retail stores has higher customer satisfaction ratings than this store?
(Short Answer)
4.8/5 (49)
Fill in the blank. __________ is a method of interpreting the standard deviation of data that have a mound-shaped, symmetric distribution.
(Multiple Choice)
4.8/5 (41)
Which of the following statements could be an explanation for the presence of an outlier in the data?
(Multiple Choice)
4.8/5 (31)
Class relative frequencies must be used, rather than class frequencies or class percentages, when
constructing a Pareto diagram.
(True/False)
4.8/5 (45)
Which number on the screen below is the sample standard deviation of the data? 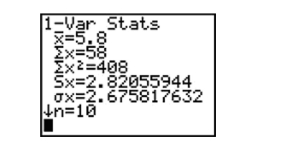
(Multiple Choice)
4.7/5 (37)
The following data represent the scores of 50 students on a statistics exam. The mean
score is 80.02, and the standard deviation is 11.9. 39 51 59 63 66 68 68 69 70 71 71 71 73 74 76 76 76 77 78 79 79 79 79 80 80 82 83 83 83 85 85 86 86 88 88 88 88 89 89 89 90 90 91 91 92 95 96 97 97 98 Use the z-score method to identify potential outliers among the scores.
(Essay)
4.8/5 (47)
A recent survey was conducted to compare the cost of solar energy to the cost of gas or electric energy. Results of the survey revealed that the distribution of the amount of the monthly utility bill
Of a 3-bedroom house using gas or electric energy had a mean of $97 and a standard deviation of
$12. If nothing is known about the shape of the distribution, what percentage of homes will have a
Monthly utility bill of less than $73?
(Multiple Choice)
4.9/5 (36)
Each year advertisers spend billions of dollars purchasing commercial time on network television. In the first 6 months of one year, advertisers spent $1.1 billion. Who were the largest spenders? In a
Recent article, the top 10 leading spenders and how much each spent (in million of dollars)were
Listed: Company A \ 72 Company F \ 27.3 Company B 63.6 Company G 25 Company C 57.3 Company H 23.8 Company D 54 Company I 23.1 Company E 31.1 Company J 19.2 Calculate the sample variance.
(Multiple Choice)
4.9/5 (40)
Which of the following statements concerning the box plot and z-score methods for detecting outliers is false?
(Multiple Choice)
4.9/5 (42)
A radio station claims that the amount of advertising each hour has a mean of 13 minutes and a standard deviation of 1.8 minutes. You listen to the radio station for 1 hour and observe that the
Amount of advertising time is 8 minutes. Calculate the z-score for this amount of advertising time.
(Multiple Choice)
4.8/5 (32)
Find the z-score for the value 83, when the mean is 52 and the standard deviation is 6.
(Multiple Choice)
4.8/5 (35)
At the U.S. Open Tennis Championship a statistician keeps track of every serve that a player hits during the tournament. The statistician reported that the mean serve speed of a particular player
Was 101 miles per hour (mph)and the standard deviation of the serve speeds was 11 mph. If
Nothing is known about the shape of the distribution, give an interval that will contain the speeds
Of at least eight-ninths of the playerʹs serves.
(Multiple Choice)
4.8/5 (38)
The temperature fluctuated between a low of 73°F and a high of 89°F. Which of the following could be calculated using just this information?
(Multiple Choice)
5.0/5 (39)
Filters
- Essay(0)
- Multiple Choice(0)
- Short Answer(0)
- True False(0)
- Matching(0)