Exam 2: Methods for Describing Sets of Data
Exam 1: Statistics, Data, and Statistical Thinking77 Questions
Exam 2: Methods for Describing Sets of Data187 Questions
Exam 3: Probability284 Questions
Exam 4: Discrete Random Variables134 Questions
Exam 5: Continuous Random Variables138 Questions
Exam 6: Sampling Distributions52 Questions
Exam 7: Inferences Based on a Single Sample: Estimation With Confidence Intervals125 Questions
Exam 8: Inferences Based on a Single144 Questions
Exam 9: Inferences Based on Two Samples: Confidence Intervals and Tests of Hypotheses100 Questions
Exam 10: Analysis of Variance: Comparing More Than Two Means91 Questions
Exam 11: Simple Linear Regression113 Questions
Exam 12: Multiple Regression and Model Building131 Questions
Exam 13: Categorical Data Analysis60 Questions
Exam 14: Nonparametric Statistics Available Online87 Questions
Select questions type
The calculator screens summarize a data set. 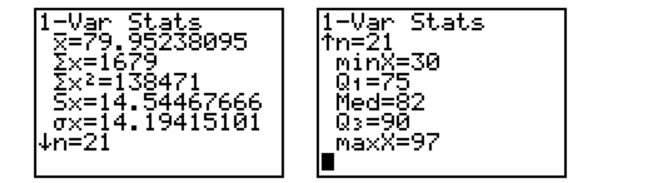 a. How many data items are in the set?
b. What is the sum of the data?
c. Identify the mean, median, and mode, if possible.
a. How many data items are in the set?
b. What is the sum of the data?
c. Identify the mean, median, and mode, if possible.
(Essay)
4.9/5  (28)
(28)
The amount spent on textbooks for the fall term was recorded for a sample of five university students - $400, $350, $600, $525, and $450. Calculate the value of the sample mean for the data.
(Multiple Choice)
4.8/5 (34)
A survey was conducted to determine how people feel about the quality of programming available on television. Respondents were asked to rate the overall quality from 0 (no quality at all)to 100
(extremely good quality). The stem-and-leaf display of the data is shown below. Stem Leaf 3 2 3 4 0 3 4 7 8 9 9 9 5 0 1 1 2 3 4 5 6 1 2 5 6 6 7 4 9 8 9 9 What percentage of the respondents rated overall television quality as very good (regarded as
Ratings of 80 and above)?
(Multiple Choice)
4.8/5 (42)
A recent survey was conducted to compare the cost of solar energy to the cost of gas or electric energy. Results of the survey revealed that the distribution of the amount of the monthly utility bill
Of a 3-bedroom house using gas or electric energy had a mean of $143 and a standard deviation of
$8. If the distribution can be considered mound-shaped and symmetric, what percentage of homes
Will have a monthly utility bill of more than $135?
(Multiple Choice)
4.8/5 (34)
In a distribution that is skewed to the right, what is the relationship of the mean, median, and mode?
(Multiple Choice)
4.9/5 (35)
The box plot shown below was constructed for the amount of soda that was poured by a filling machine into 12-ounce soda cans at a local soda bottling company. 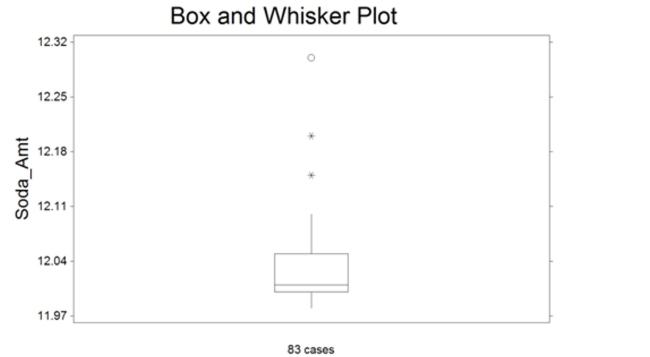 We see that one soda can received 12.15 ounces of soda on the plot above. Based on the box plot
Presented, how would you classify this observation?
We see that one soda can received 12.15 ounces of soda on the plot above. Based on the box plot
Presented, how would you classify this observation?
(Multiple Choice)
4.9/5 (33)
A recent survey was conducted to compare the cost of solar energy to the cost of gas or
electric energy. Results of the survey revealed that the distribution of the amount of the
monthly utility bill of a 3-bedroom house using gas or electric energy had a mean of
$118.00 and a standard deviation of $15.00. Assuming the distribution is mound-shaped
and symmetric, would you expect to see a 3-bedroom house using gas or electric energy
with a monthly utility bill of $230.50? Explain.
(Essay)
4.8/5 (34)
At the U.S. Open Tennis Championship a statistician keeps track of every serve that a player hits during the tournament. The statistician reported that the mean serve speed was 100 miles per hour
(mph)and the standard deviation of the serve speeds was 15 mph. If nothing is known about the
Shape of the distribution, what percentage of the playerʹs serve speeds are less than 70 mph?
(Multiple Choice)
5.0/5 (40)
During one recent year, U.S. consumers redeemed 6.16 billion manufacturersʹ coupons and saved themselves $2.27 billion. Calculate and interpret the mean savings per coupon.
(Multiple Choice)
4.9/5 (32)
In general, the sample mean is a better estimator of the population mean for larger sample sizes.
(True/False)
4.9/5 (38)
Each year advertisers spend billions of dollars purchasing commercial time on network
television. In the first 6 months of one year, advertisers spent $1.1 billion. Who were the
largest spenders? In a recent article, the top 10 leading spenders and how much each
spent (in million of dollars)were listed: Company A \ 72.2 Company F \ 27.2 Company B 63 Company G 24.2 Company C 57.2 Company H 22.5 Company D 55.3 Company I 22.1 Company E 30.5 Company J 19.4 Calculate the mean and median for the data.
(Essay)
4.8/5 (37)
In skewed distributions, the mean is the best measure of the center of the distribution since it is
least affected by extreme observations.
(True/False)
4.9/5 (31)
At the U.S. Open Tennis Championship a statistician keeps track of every serve that a player hits during the tournament. The statistician reported that the mean serve speed of a particular player
Was 105 miles per hour. Suppose that the statistician indicated that the serve speed distribution
Was skewed to the left. Which of the following values is most likely the value of the median serve
Speed?
(Multiple Choice)
4.7/5 (39)
A Pareto diagram is a pie chart where the slices are arranged from largest to smallest in a
counterclockwise direction.
(True/False)
4.8/5 (34)
The total points scored by a basketball team for each game during its last season have been
summarized in the table below. Identify the modal class of the distribution of scores. Score Frequency 41-60 3 61-80 8 81-100 12 101-120 7
(Essay)
4.8/5 (43)
Summary information is given for the weights (in pounds)of 1000 randomly sampled tractor trailers. MIN: 4013 25\%: 5613 MAX: 10,613 75\%: 8613 AVE: 7013 Std. Dev.: 1400 Find the percentage of tractor trailers with weights between 5613 and 8613 pounds.
(Multiple Choice)
4.9/5 (44)
Explain how it can be misleading to report only the mean of a distribution without any
measure of the variability.
(Essay)
5.0/5 (36)
Fill in the blank. One advantage of the __________ is that the actual data values are retained in the graphical summarization of the data.
(Multiple Choice)
4.9/5 (39)
The total points scored by a basketball team for each game during its last season have
been summarized in the table below. Score Frequency 41-60 3 61-80 8 81-100 12 101-120 7 a. Explain why you cannot use the information in the table to construct a stem-and-leaf
display for the data.
b. Construct a histogram for the scores.
(Essay)
4.9/5 (35)
Filters
- Essay(0)
- Multiple Choice(0)
- Short Answer(0)
- True False(0)
- Matching(0)