Exam 2: Methods for Describing Sets of Data
Exam 1: Statistics, Data, and Statistical Thinking77 Questions
Exam 2: Methods for Describing Sets of Data187 Questions
Exam 3: Probability284 Questions
Exam 4: Discrete Random Variables134 Questions
Exam 5: Continuous Random Variables138 Questions
Exam 6: Sampling Distributions52 Questions
Exam 7: Inferences Based on a Single Sample: Estimation With Confidence Intervals125 Questions
Exam 8: Inferences Based on a Single144 Questions
Exam 9: Inferences Based on Two Samples: Confidence Intervals and Tests of Hypotheses100 Questions
Exam 10: Analysis of Variance: Comparing More Than Two Means91 Questions
Exam 11: Simple Linear Regression113 Questions
Exam 12: Multiple Regression and Model Building131 Questions
Exam 13: Categorical Data Analysis60 Questions
Exam 14: Nonparametric Statistics Available Online87 Questions
Select questions type
The amount of time workers spend commuting to their jobs each day in a large metropolitan city has a mean of 70 minutes and a standard deviation of 20 minutes. Assuming nothing is known
About the shape of the distribution of commuting times, what percentage of these commuting
Times are between 30 and 110 minutes?
(Multiple Choice)
4.8/5  (34)
(34)
The box plot shown below displays the amount of soda that was poured by a filling machine into 12-ounce soda cans at a local bottling company. 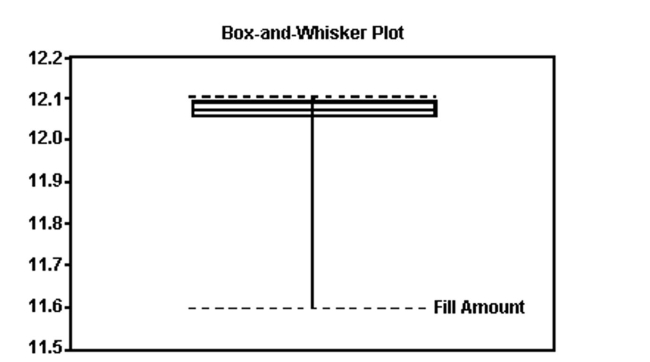 Based on the box plot, what shape do you believe the distribution of the data to have?
(Multiple Choice)
4.9/5 (36)
In symmetric distributions, the mean and the median will be approximately equal.
(True/False)
4.8/5 (37)
The test scores of 30 students are listed below. Which number could be the 30th percentile?
31 41 45 48 52 55 56 56 63 65
67 67 69 70 70 74 75 78 79 79
80 81 83 85 85 87 90 92 95 99
(Multiple Choice)
4.8/5 (44)
A larger standard deviation means greater variability in the data.
(True/False)
4.8/5 (39)
What number is missing from the table? Grades on Test Frequency Relative Frequency A 6 .24 B 7 C 9 .36 D 2 .08 F 1 .04
(Multiple Choice)
4.8/5 (42)
A sociologist recently conducted a survey of citizens over 60 years of age who have net worths too high to qualify for Medicaid but have no private health insurance. The ages of the 25 uninsured
Senior citizens were as follows: 68 73 66 76 86 74 61 89 65 90 69 92 76 62 81 63 68 81 70 73 60 87 75 64 82 Find the upper quartile of the data.
(Multiple Choice)
4.8/5 (41)
The ages of five randomly chosen professors are 47, 55, 52, 63, and 66. Calculate the
sample variance of these ages.
(Essay)
4.7/5 (33)
The data below represent the numbers of absences and the final grades of 15 randomly
selected students from a statistics class. Construct a scattergram for the data. Do you
detect a trend? Student Number of Absences Final Grade as a Percent 1 5 79 2 6 78 3 2 86 4 12 56 5 9 75 6 5 90 7 8 78 8 15 48 9 0 92 10 1 78 11 9 81 12 3 86 13 10 75 14 3 89 15 11 65
(Essay)
4.9/5 (35)
The scores of nine members of a womenʹs golf team in two rounds of tournament play are
listed below. Player 1 2 3 4 5 6 7 8 9 Round 1 85 90 87 78 92 85 79 93 86 Round 2 90 87 85 84 86 78 77 91 82 Construct a scattergram for the data.
(Essay)
4.7/5 (27)
Calculate the range of the following data set: 8, 7, 9, 1, 6, 10, 4, 7, 4
(Multiple Choice)
4.9/5 (35)
At the U.S. Open Tennis Championship a statistician keeps track of every serve that a player hits during the tournament. The statistician reported that the mean serve speed was 100 miles per hour
(mph)and the standard deviation of the serve speeds was 15 mph. Assume that the statistician
Also gave us the information that the distribution of serve speeds was mound-shaped and
Symmetric. What percentage of the playerʹs serves were between 115 mph and 145 mph?
(Multiple Choice)
4.8/5 (27)
If 25% of your statistics class is sophomores, then in a pie chart representing classifications of the
students in your statistics class the slice assigned to sophomores is 90°.
(True/False)
4.8/5 (39)
Use a graphing calculator or software to construct a box plot for the following data set. 12 18 14 17 19 16 14 18 15 17 11 13 14 11 16 18 15 13 17 15 14 19 12 16 17
(Essay)
4.8/5 (37)
By law, a box of cereal labeled as containing 32 ounces must contain at least 32 ounces of
cereal. The machine filling the boxes produces a distribution of fill weights that is
mound-shaped and symmetric, with a mean equal to the setting on the machine and with
a standard deviation equal to 0.04 ounce. To ensure that most of the boxes contain at least
32 ounces, the machine is set so that the mean fill per box is 32.12 ounces. What percentage
of the boxes do, in fact, contain at least 32 ounces?
(Essay)
4.8/5 (26)
The amount spent on textbooks for the fall term was recorded for a sample of five university students - $400, $350, $600, $525, and $450. Calculate the value of the sample median for the data.
(Multiple Choice)
4.8/5 (34)
The output below displays the mean and median for the state high school dropout rates in
year 1 and in year 5. Year 1 Year 5 N 51 51 MEAN 28.97 26.36 MEDIAN 27.42 25.25 Use the information to determine the shape of the distributions of the high school dropout
rates in year 1 and year 5.
(Essay)
4.8/5 (34)
Either vertical or horizontal bars can be used when constructing a bar graph.
(True/False)
4.9/5 (37)
The amount spent on textbooks for the fall term was recorded for a sample of five university students - $400, $350, $600, $525, and $450. Calculate the value of the sample range for the data.
(Multiple Choice)
4.9/5 (37)
Filters
- Essay(0)
- Multiple Choice(0)
- Short Answer(0)
- True False(0)
- Matching(0)