Exam 2: Methods for Describing Sets of Data
Exam 1: Statistics, Data, and Statistical Thinking77 Questions
Exam 2: Methods for Describing Sets of Data187 Questions
Exam 3: Probability284 Questions
Exam 4: Discrete Random Variables134 Questions
Exam 5: Continuous Random Variables138 Questions
Exam 6: Sampling Distributions52 Questions
Exam 7: Inferences Based on a Single Sample: Estimation With Confidence Intervals125 Questions
Exam 8: Inferences Based on a Single144 Questions
Exam 9: Inferences Based on Two Samples: Confidence Intervals and Tests of Hypotheses100 Questions
Exam 10: Analysis of Variance: Comparing More Than Two Means91 Questions
Exam 11: Simple Linear Regression113 Questions
Exam 12: Multiple Regression and Model Building131 Questions
Exam 13: Categorical Data Analysis60 Questions
Exam 14: Nonparametric Statistics Available Online87 Questions
Select questions type
A sociologist recently conducted a survey of senior citizens who have net worths too high to qualify for Medicaid but have no private health insurance. The ages of the 25 uninsured senior
Citizens were as follows: 67 72 65 75 85 73 60 88 64 89 68 91 75 61 80 62 67 80 69 72 59 86 74 63 81 Find the median of the observations.
(Multiple Choice)
4.8/5  (37)
(37)
The amount spent on textbooks for the fall term was recorded for a sample of five hundred university students. It was determined that the 75th percentile was the value $500. Which of the
Following interpretations of the 75th percentile is correct?
(Multiple Choice)
4.9/5 (31)
The data show the total number of medals (gold, silver, and bronze)won by each country
winning at least one gold medal in the Winter Olympics. Find the range, sample variance,
and sample standard deviation of the numbers of medals won by these countries. 1 2 3 3 4 9 9 11 11 11 14 14 19 22 23 24 25 29
(Essay)
4.7/5 (34)
For large data sets, a stem-and-leaf display is a better choice than a histogram.
(True/False)
4.8/5 (35)
Scatterplots are useful for both qualitative and quantitative data.
(True/False)
4.8/5 (42)
The outer fences of a box plot are three standard deviations from the mean.
(True/False)
4.8/5 (42)
The z-score for a value x is -2.5. State whether the value of x lies above or below the
mean and by how many standard deviations.
(Essay)
4.9/5 (43)
A sociologist recently conducted a survey of citizens over 60 years of age who have net worths too high to qualify for Medicaid but have no private health insurance. The ages of the 25 uninsured
Senior citizens were as follows: 68 73 66 76 86 74 61 89 65 90 69 92 76
62 81 63 68 81 70 73 60 87 75 64 82 Suppose the mean and standard deviation are 74.04 and 9.75, respectively. If we assume that the
Distribution of ages is mound-shaped and symmetric, what percentage of the respondents will be
Between 64.29 and 93.54 years old?
(Multiple Choice)
4.9/5 (42)
When Scholastic Achievement Test scores (SATs)are sent to test-takers, the percentiles associated with scores are also given. Suppose a test-taker scored at the 56th percentile on the verbal part of
The test and at the 34th percentile on the quantitative part. Interpret these results.
(Multiple Choice)
4.9/5 (32)
The calculator screens summarize a data set. 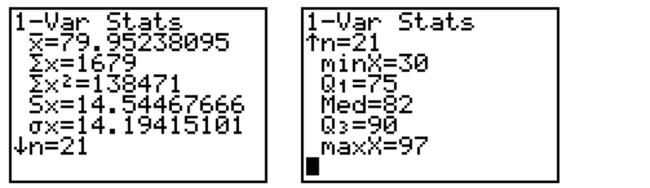 a. Identify the smallest measurement in the data set.
b. Identify the largest measurement in the data set.
c. Calculate the range of the data set.
a. Identify the smallest measurement in the data set.
b. Identify the largest measurement in the data set.
c. Calculate the range of the data set.
(Essay)
4.9/5 (37)
On a given day, the price of a gallon of milk had a mean price of $2.03 with a standard deviation of $0.07. A particular food store sold milk for $1.96/gallon. Interpret the z-score for this gas station.
(Multiple Choice)
4.9/5 (36)
By law, a box of cereal labeled as containing 20 ounces must contain at least 20 ounces of cereal. The machine filling the boxes produces a distribution of fill weights with a mean equal to the
Setting on the machine and with a standard deviation equal to 0.04 ounce. To ensure that most of
The boxes contain at least 20 ounces, the machine is set so that the mean fill per box is 20.12 ounces.
Assuming nothing is known about the shape of the distribution, what can be said about the
Proportion of cereal boxes that contain less than 20 ounces.
(Multiple Choice)
4.8/5 (35)
Which of the following is a measure of the variability of a distribution?
(Multiple Choice)
4.9/5 (30)
The box plot shown below was constructed for the amount of soda that was poured by a filling machine into 12-ounce soda cans at a local soda bottling company. 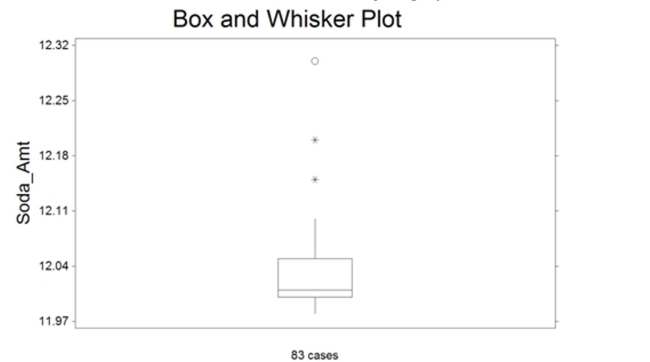 We see that one soda can received 12.30 ounces of soda on the plot above. Based on the box plot
Presented, how would you classify this observation?
We see that one soda can received 12.30 ounces of soda on the plot above. Based on the box plot
Presented, how would you classify this observation?
(Multiple Choice)
4.8/5 (33)
For a given data set, the lower quartile is 45, the median is 50, and the upper quartile is 57.
The minimum value in the data set is 32, and the maximum is 81.
a. Find the interquartile range.
b. Find the inner fences.
c. Find the outer fences.
d. Is either of the minimum or maximum values considered an outlier? Explain.
(Essay)
4.7/5 (32)
Many firms use on-the-job training to teach their employees computer programming. Suppose you work in the personnel department of a firm that just finished training a group of its employees
To program, and you have been requested to review the performance of one of the trainees on the
Final test that was given to all trainees. The mean and standard deviation of the test scores are 80
And 5, respectively. Assuming nothing is known about the distribution, what percentage of
Test-takers scored above 95?
(Multiple Choice)
4.9/5 (36)
Parking at a university has become a problem. University administrators are interested in determining the average time it takes a student to find a parking spot. An administrator
Inconspicuously followed 120 students and recorded how long it took each of them to find a
Parking spot. Which of the following types of graphs should not be used to display information
Concerning the students parking times?
(Multiple Choice)
4.9/5 (35)
In an eye color study, 25 out of 50 people in the sample had brown eyes. In this situation, what does the number .50 represent?
(Multiple Choice)
4.9/5 (33)
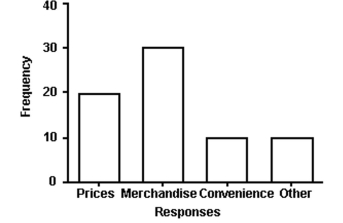 The manager of a store conducted a customer survey to determine why customers shopped at the store. The results are shown in the figure. What proportion of customers responded that merchandise was the reason they shopped at the store?
(Multiple Choice)
4.8/5 (37)
Filters
- Essay(0)
- Multiple Choice(0)
- Short Answer(0)
- True False(0)
- Matching(0)