Exam 3: Describing Data Using Numerical Measures
Exam 1: The Where, Why, and How of Data Collection167 Questions
Exam 2: Graphs, Charts and Tablesdescribing Your Data138 Questions
Exam 3: Describing Data Using Numerical Measures138 Questions
Exam 4: Introduction to Probability125 Questions
Exam 5: Discrete Probability Distributions161 Questions
Exam 6: Introduction to Continuous Probability Distributions122 Questions
Exam 7: Introduction to Sampling Distributions136 Questions
Exam 8: Estimating Single Population Parameters174 Questions
Exam 9: Introduction to Hypothesis Testing183 Questions
Exam 10: Estimation and Hypothesis Testing for Two Population Parameters121 Questions
Exam 11: Hypothesis Tests and Estimation for Population Variances69 Questions
Exam 12: Analysis of Variance162 Questions
Exam 13: Goodness-Of-Fit Tests and Contingency Analysis105 Questions
Exam 14: Introduction to Linear Regression and Correlation Analysis139 Questions
Exam 15: Multiple Regression Analysis and Model Building148 Questions
Exam 16: Analyzing and Forecasting Time-Series Data131 Questions
Exam 17: Introduction to Nonparametric Statistics103 Questions
Exam 18: Introducing Business Analytics48 Questions
Exam 19: Introduction to Decision Analysis48 Questions
Exam 20: Introduction to Quality and Statistical Process Control42 Questions
Select questions type
A store manager tracks the number of customer complaints each week. The following data reflect a random sample of ten weeks.  The range for these data is 8.
(True/False)
4.9/5  (31)
(31)
A box and whisker plot shows where the mean value falls relative to the median for a variable.
(True/False)
4.7/5 (36)
A small company has 7 employees. The numbers of years these employees have worked for this company are shown as follows:  Based upon this information, the mode number of years that employees have been with this company is:
(Multiple Choice)
4.8/5 (26)
Dynamic random-access memory (DRAM) memory chips are made from silicon wafers in manufacturing facilities through a very complex process called wafer fabs. The wafers are routed through the fab machines in an order that is referred to as a recipe. The wafers may go through the same machine several times as the chip is created. The data file DRAM Chips contains a sample of processing times, measured in fractions of hours, at a particular machine center for one chip recipe. Compute the median processing time.
(Multiple Choice)
4.8/5 (34)
Which of the following is the most frequently used measure of variation?
(Multiple Choice)
4.8/5 (31)
The advantage of using the interquartile range as a measure of variation is that it utilizes all the data in its computation.
(True/False)
4.9/5 (39)
The asking price for homes on the real estate market in Baltimore has a mean value of $286,455 and a standard deviation of $11,200. Four homes are listed by one real estate company with the following prices: 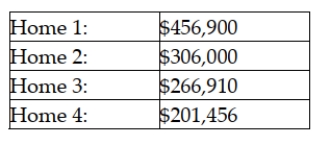 Based upon this information, which house has a standardized value that is relatively closest to zero?
(Multiple Choice)
4.8/5 (35)
Based on the empirical rule we can expect about 95 percent of the values in bell-shaped distributions to be within ± one standard deviation of the mean.
(True/False)
4.8/5 (39)
If after graphing the data for a quantitative variable of interest, you notice that the distribution is highly skewed in the positive direction, the measure of central location that would likely provide the best assessment of the center would be the median.
(True/False)
4.8/5 (35)
The asking price for homes on the real estate market in Baltimore has a mean value of $286,455 and a standard deviation of $11,200. The mean and standard deviation in asking price for homes in Denver are $188,468 and $8,230, respectively. Recently, one home sold in each city where the asking price for each home was $193,000. Based on these data, which of the following conclusions can be made?
(Multiple Choice)
4.9/5 (28)
Suppose the standard deviation for a given sample is known to be 20. If the data in the sample are doubled, the standard deviation will be significantly greater.
(True/False)
4.8/5 (40)
Which of the following measures is not affected by extreme values in the data?
(Multiple Choice)
4.8/5 (37)
Suppose that the distribution of grocery purchases is thought to be symmetric. If the mean purchase is $23.14, what would the median purchase be?
(Essay)
4.7/5 (29)
When surveyed, a sample of 1,250 patients at a regional hospital provided interviewers with the following summary statistics pertaining to the hospital charges: Minimum = $278.00 Q1 = $1,245 Q2 = $3,567 Q3= $4,702. Based on these data, the distribution is seen to be symmetric.
(True/False)
4.8/5 (28)
Suppose a distribution has a mean of 80 and standard deviation of 10. It is found that 84 percent of the values in the data set lie between 70 and 90. This implies that the distribution is not bell-shaped.
(True/False)
4.9/5 (35)
A professor wishes to develop a numerical method for giving grades. He intends to base the grade on homework, two midterms, a project, and a final examination. He wishes the final exam to have the largest influence on the grade. He wants the project to have 10%, each midterm to have 20%, and the homework to have 10% of the influence of the semester grade. Determine the weights the professor should use to produce a weighted average for grading purposes.
(Multiple Choice)
4.8/5 (31)
The following sample data reflect electricity bills for ten households in San Diego in March. 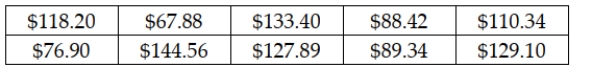 Determine three measures of central tendency for these sample data. Then, based on these measures, determine whether the sample data are symmetric or skewed.
(Essay)
4.9/5 (25)
What is meant by the concept, standardizing the data? Explain why a decision maker may wish to compute a standardized value.
(Essay)
4.9/5 (35)
Filters
- Essay(0)
- Multiple Choice(0)
- Short Answer(0)
- True False(0)
- Matching(0)