Exam 3: Describing Data Using Numerical Measures
Exam 1: The Where, Why, and How of Data Collection167 Questions
Exam 2: Graphs, Charts and Tablesdescribing Your Data138 Questions
Exam 3: Describing Data Using Numerical Measures138 Questions
Exam 4: Introduction to Probability125 Questions
Exam 5: Discrete Probability Distributions161 Questions
Exam 6: Introduction to Continuous Probability Distributions122 Questions
Exam 7: Introduction to Sampling Distributions136 Questions
Exam 8: Estimating Single Population Parameters174 Questions
Exam 9: Introduction to Hypothesis Testing183 Questions
Exam 10: Estimation and Hypothesis Testing for Two Population Parameters121 Questions
Exam 11: Hypothesis Tests and Estimation for Population Variances69 Questions
Exam 12: Analysis of Variance162 Questions
Exam 13: Goodness-Of-Fit Tests and Contingency Analysis105 Questions
Exam 14: Introduction to Linear Regression and Correlation Analysis139 Questions
Exam 15: Multiple Regression Analysis and Model Building148 Questions
Exam 16: Analyzing and Forecasting Time-Series Data131 Questions
Exam 17: Introduction to Nonparametric Statistics103 Questions
Exam 18: Introducing Business Analytics48 Questions
Exam 19: Introduction to Decision Analysis48 Questions
Exam 20: Introduction to Quality and Statistical Process Control42 Questions
Select questions type
A major retail store has studied customer behavior and found that the distribution of time customers spend in a store per visit is symmetric with a mean equal to 17.3 minutes. Based on this information, which of the following is true?
(Multiple Choice)
4.8/5  (33)
(33)
When a variance is calculated for a data set, the resulting value is the same regardless of whether the data set is treated as a population or a sample.
(True/False)
4.9/5 (42)
A report on spending by adults on recreation stated the following: At least 75 percent of the people in the survey spend between $750 and $1,250 per year. The report also said that at least 88 percent spend between $625 and $1,375 per year. Given this information, which of the following is most apt to be true?
(Multiple Choice)
4.8/5 (25)
The Good-Guys Car Dealership has tracked the number of used cars sold at its downtown dealership.Consider the following data as representing the population of cars sold in each of the 8 weeks that the dealership has been open.  The population range is 9.
(True/False)
4.7/5 (33)
Data was collected on the number of television sets in a household, and it was found that the mean was 3.5 and the standard deviation was 0.75. Based on these sample data, what is the standardized value corresponding to 5 televisions?
(Multiple Choice)
4.8/5 (36)
The interquartile range contains the middle 50 percent of a data set.
(True/False)
4.8/5 (32)
Consider the following sample data:  For these data the sample mean is:
(Multiple Choice)
4.8/5 (39)
Populations with larger means will also have larger standard deviations since the data will be more spread out for populations with larger means.
(True/False)
4.8/5 (29)
If a business manager selected a sample of customers and computed the mean income for this sample of customers, she has computed:
(Multiple Choice)
4.8/5 (33)
At a sawmill in Oregon, a process improvement team measured the diameters for a sample of 1,500 logs. The following summary statistics were computed: 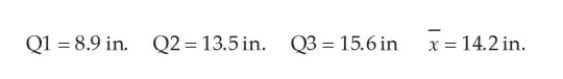 Given this information, in a box and whisker plot, which of these four values will NOT appear?
(Multiple Choice)
4.8/5 (35)
The second quartile for a set of data will have the same value as the 50th percentile only when the data are symmetric.
(True/False)
4.8/5 (36)
The following data reflect the number of customers who test drove new cars each day for a sample of 20 days at the Redfield Ford Dealership. 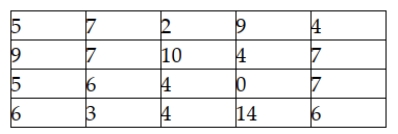 Given these data, what is the variance?
(Multiple Choice)
4.7/5 (38)
If a population standard deviation is computed to be 345, it will almost always be the case that a standard deviation computed from a random sample from that population will be larger than 345.
(True/False)
4.8/5 (35)
Recently an article in a newspaper stated that 75 percent of the households in the state had incomes of $20,200 or below. Given this input, it is certain that mean household income is less than $20,200.
(True/False)
4.9/5 (27)
A statistic is a value that describes a population characteristic while a parameter is computed from a sample.
(True/False)
4.8/5 (28)
Each year, Business Week publishes information and rankings of master of business administration (MBA) programs. The data file MBA Analysis contains data on several variables for eight reputable MBA programs as presented in the October 2, 2000, issue of Business Week. The variables include pre- and post- MBA salary, percentage salary increase, undergraduate GPA, average Graduate Management Admission Test (GMAT) score, annual tuition, and expected annual student cost. Compute the mean and median for each of the variables in the database.
(Multiple Choice)
4.9/5 (28)
You are given the following data:  Assuming that these data are a sample selected from a larger population, the median value for these sample data is 25.5.
(True/False)
4.7/5 (32)
Suppose a study of houses that have sold recently in your community showed the following frequency distribution for the number of bedrooms: 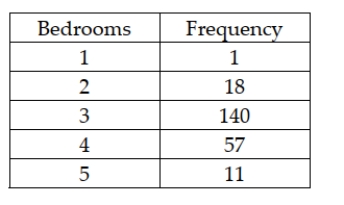 Based on this information, it is possible to determine that the distribution of bedrooms in homes sold is right-skewed.
(True/False)
4.9/5 (38)
Filters
- Essay(0)
- Multiple Choice(0)
- Short Answer(0)
- True False(0)
- Matching(0)