Exam 3: Describing Data Using Numerical Measures
Exam 1: The Where, Why, and How of Data Collection167 Questions
Exam 2: Graphs, Charts and Tablesdescribing Your Data138 Questions
Exam 3: Describing Data Using Numerical Measures138 Questions
Exam 4: Introduction to Probability125 Questions
Exam 5: Discrete Probability Distributions161 Questions
Exam 6: Introduction to Continuous Probability Distributions122 Questions
Exam 7: Introduction to Sampling Distributions136 Questions
Exam 8: Estimating Single Population Parameters174 Questions
Exam 9: Introduction to Hypothesis Testing183 Questions
Exam 10: Estimation and Hypothesis Testing for Two Population Parameters121 Questions
Exam 11: Hypothesis Tests and Estimation for Population Variances69 Questions
Exam 12: Analysis of Variance162 Questions
Exam 13: Goodness-Of-Fit Tests and Contingency Analysis105 Questions
Exam 14: Introduction to Linear Regression and Correlation Analysis139 Questions
Exam 15: Multiple Regression Analysis and Model Building148 Questions
Exam 16: Analyzing and Forecasting Time-Series Data131 Questions
Exam 17: Introduction to Nonparametric Statistics103 Questions
Exam 18: Introducing Business Analytics48 Questions
Exam 19: Introduction to Decision Analysis48 Questions
Exam 20: Introduction to Quality and Statistical Process Control42 Questions
Select questions type
The Empirical Rule states that for a bell-shaped distribution, approximately 95 percent of data should lie within:
(Multiple Choice)
4.9/5  (34)
(34)
A data set in which the mean, median, and mode are all equal is said to be a skewed distribution.
(True/False)
4.9/5 (37)
The following data reflect the number of customers who return merchandise for a refund on Monday. Note these data reflect the population of all 10 Mondays for which data are available. 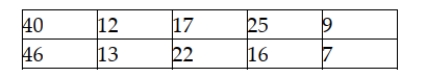 Based on these data, what is the standard deviation?
(Multiple Choice)
4.7/5 (31)
The owner of a local gasoline station has kept track of the number of gallons of regular unleaded sold at his station every day since he purchased the station. This morning, he computed the mean number of gallons. This value would be considered a statistic.
(True/False)
4.8/5 (23)
If a data set has 740 values that have been sorted from low to high, which value in the data set will be the 20th percentile?
(Multiple Choice)
5.0/5 (29)
At a sawmill in Oregon, a process improvement team measured the diameters for a sample of 1,500 logs. The following summary statistics were computed:  Given this information, the boundaries on the box in a box and whisker plot are:
(Multiple Choice)
4.7/5 (30)
Why is it that when we find the sample standard deviation, we divide by n-1 but when we find the population standard deviation we divide by n?
(Essay)
4.8/5 (36)
The Good-Guys Car Dealership has tracked the number of used cars sold at its downtown dealership.Consider the following data as representing the population of cars sold in each of the 8 weeks that the dealership has been open.  The population standard deviation is approximately 2.87 cars.
(True/False)
4.8/5 (34)
A distribution is said to be symmetric when the sample mean and the population mean are equal.
(True/False)
4.9/5 (39)
For ordinal data, ________ is the preferred measure of central location.
(Multiple Choice)
4.8/5 (33)
You are given the following data: 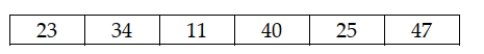 Assuming that the data reflect a sample from a larger population, the sample mean is 30.00.
(True/False)
5.0/5 (35)
Data are considered to be right-skewed when the mean lies to the right of the median.
(True/False)
4.8/5 (39)
A professor wishes to develop a numerical method for giving grades. He intends to base the grade on homework, two midterms, a project, and a final examination. He wishes the final exam to have the largest influence on the grade. He wants the project to have 10%, each midterm to have 20%, and the homework to have 10% of the influence of the semester grade. For a student with the following grades during the quarter, calculate a weighted average for the course: 
(Multiple Choice)
4.9/5 (30)
It is possible for a set of data to have multiple modes as well as multiple medians, but there can be only one mean.
(True/False)
4.8/5 (39)
A set of data is considered to be symmetric if the 3rd quartile is three times larger than the 1st quartile.
(True/False)
4.9/5 (35)
Explain when the empirical rule can be used to help describe data in a population or a sample, defining which data distributions cannot be explained by this rule.
(Essay)
4.9/5 (31)
Acme Taxi has two taxi cabs. The manager tracks the daily revenue for each cab. Over the past 20 days, Cab A has averaged $76.00 per night with a standard deviation equal to $11.00. Cab B has averaged $200.00 per night with a standard deviation of $18.00. Based on this information, the coefficient of variation for Cab B is 9 percent.
(True/False)
4.8/5 (35)
A recent study involving a sample of 3,000 vehicles in California showed the following statistics related to the number of miles driven per day: Q1 = 12, Q2 = 45, and Q3 = 56. Based on these data, if a box and whisker plot is developed, a value of 110 is an outlier.
(True/False)
4.8/5 (34)
A marketing manager for the Verizon cell phone company selected a random sample of 250 customers from the list of 10,556 total customers in a particular region. The mean monthly bill for the last six months based on the sample data is $65.70. The manager should realize that the mean bill for all 10,556 customers will actually be much higher than the sample mean of $65.70.
(True/False)
4.7/5 (39)
Filters
- Essay(0)
- Multiple Choice(0)
- Short Answer(0)
- True False(0)
- Matching(0)