Exam 3: Describing Data Using Numerical Measures
Exam 1: The Where, Why, and How of Data Collection167 Questions
Exam 2: Graphs, Charts and Tablesdescribing Your Data138 Questions
Exam 3: Describing Data Using Numerical Measures138 Questions
Exam 4: Introduction to Probability125 Questions
Exam 5: Discrete Probability Distributions161 Questions
Exam 6: Introduction to Continuous Probability Distributions122 Questions
Exam 7: Introduction to Sampling Distributions136 Questions
Exam 8: Estimating Single Population Parameters174 Questions
Exam 9: Introduction to Hypothesis Testing183 Questions
Exam 10: Estimation and Hypothesis Testing for Two Population Parameters121 Questions
Exam 11: Hypothesis Tests and Estimation for Population Variances69 Questions
Exam 12: Analysis of Variance162 Questions
Exam 13: Goodness-Of-Fit Tests and Contingency Analysis105 Questions
Exam 14: Introduction to Linear Regression and Correlation Analysis139 Questions
Exam 15: Multiple Regression Analysis and Model Building148 Questions
Exam 16: Analyzing and Forecasting Time-Series Data131 Questions
Exam 17: Introduction to Nonparametric Statistics103 Questions
Exam 18: Introducing Business Analytics48 Questions
Exam 19: Introduction to Decision Analysis48 Questions
Exam 20: Introduction to Quality and Statistical Process Control42 Questions
Select questions type
The asking price for homes on the real estate market in Baltimore has a mean value of $286,455 and a standard deviation of $11,200. The mean and standard deviation in asking price for homes in Denver are $188,468 and $8,230, respectively. Recently, one home sold in each city where the asking price for each home was $193,000. Assuming that both distributions are bell-shaped, which of the following statements is true?
(Multiple Choice)
4.8/5  (34)
(34)
You are given the following data:  If these data were considered to be a population and you computed the mean, you would get the same answer as if these data were considered to be a sample from a larger population.
(True/False)
4.9/5 (40)
If a set of data has 1,500 values, the 30th percentile value will correspond to the 450th value in the data when the data have been arranged in numerical order.
(True/False)
4.8/5 (37)
Consider the following sample data:  For these data the median is:
(Multiple Choice)
5.0/5 (34)
Portfolio A of a collection of stocks is considered more risky than portfolio B if:
(Multiple Choice)
4.8/5 (35)
The distribution of dollars paid for car insurance by car owners in a major east coast city is bell- shaped with a mean equal to $750 every six months and a standard deviation equal to $100. Based on this information we should use Tchebysheff's theorem to determine the conservative percentage of car owners that will pay between $550 and $950 for car insurance.
(True/False)
4.9/5 (35)
The advantage of using the interquartile range versus the range as a measure of variation is:
(Multiple Choice)
4.9/5 (31)
The distribution of bankcard balances for customers is highly right-skewed with a mean of $1,100 and a standard deviation equal to $250. Based on this information, approximately 68 percent of the customers will have bank balances between $850 and $1,350.
(True/False)
4.7/5 (32)
A sample of people who have attended a college football game at your university has a mean = 3.2 members in their family. The mode number of family members is 2 and the median number is 2.0. Based on this information:
(Multiple Choice)
4.7/5 (41)
One of the primary advantages of using the median as a measure of the center for a set of data is that the median is not affected by extreme values in the data.
(True/False)
4.8/5 (38)
A dairy farm in Wisconsin bottles milk in one gallon containers. At a recent meeting, the production manager asked top management for a new filling machine that he argued would assure that all containers had exactly one gallon of milk. Based on sound statistical principles, the top management group should conclude that the production manager could have merit to his argument.
(True/False)
4.9/5 (27)
In comparing two distributions with the same mean, the coefficient of variation is the only way to assess which distribution has the greatest relative variability.
(True/False)
4.8/5 (45)
The number of days that homes stay on the market before they sell in Seattle is bell-shaped with a mean equal to 8 days. Further, 95 percent of all homes are on the market between 2 and 14 days. Based on this information, what is the standard deviation for the number of days that houses stay on the market in Seattle?
(Multiple Choice)
4.9/5 (25)
If a set of data has 540 values, the 3rd quartile corresponds to approximately the 135th value when the data have been arranged in numerical order.
(True/False)
4.8/5 (34)
Consider the following data, which represent the number of miles that employees commute from home to work each day. There are two samples: one for males and one for females. 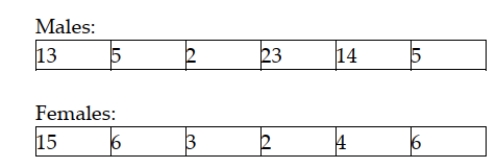
(Multiple Choice)
4.7/5 (43)
When comparing data measured by substantially different scales, we must use:
(Multiple Choice)
4.8/5 (41)
The Good-Guys Car Dealership has tracked the number of used cars sold at its downtown dealership.Consider the following data as representing the population of cars sold in each of the 8 weeks that the dealership has been open.  The population variance is approximately 9.43.
(True/False)
4.7/5 (30)
The Parks and Recreation manager for the city of Detroit recently submitted a report to the city council in which he indicated that a random sample of 500 park users indicated that the average number of visits per month was 4.56. This value should be viewed as a statistic by the city council.
(True/False)
4.9/5 (37)
When the median of a data set is 110 and the mean is 127, the percentile associated with the mean must be higher than 50 percent.
(True/False)
4.8/5 (47)
In drawing a box and whisker plot the upper limit length of the whiskers is 1.5(Q3-Q1).
(True/False)
4.9/5 (28)
Filters
- Essay(0)
- Multiple Choice(0)
- Short Answer(0)
- True False(0)
- Matching(0)