Exam 3: Describing Data Using Numerical Measures
Exam 1: The Where, Why, and How of Data Collection167 Questions
Exam 2: Graphs, Charts and Tablesdescribing Your Data138 Questions
Exam 3: Describing Data Using Numerical Measures138 Questions
Exam 4: Introduction to Probability125 Questions
Exam 5: Discrete Probability Distributions161 Questions
Exam 6: Introduction to Continuous Probability Distributions122 Questions
Exam 7: Introduction to Sampling Distributions136 Questions
Exam 8: Estimating Single Population Parameters174 Questions
Exam 9: Introduction to Hypothesis Testing183 Questions
Exam 10: Estimation and Hypothesis Testing for Two Population Parameters121 Questions
Exam 11: Hypothesis Tests and Estimation for Population Variances69 Questions
Exam 12: Analysis of Variance162 Questions
Exam 13: Goodness-Of-Fit Tests and Contingency Analysis105 Questions
Exam 14: Introduction to Linear Regression and Correlation Analysis139 Questions
Exam 15: Multiple Regression Analysis and Model Building148 Questions
Exam 16: Analyzing and Forecasting Time-Series Data131 Questions
Exam 17: Introduction to Nonparametric Statistics103 Questions
Exam 18: Introducing Business Analytics48 Questions
Exam 19: Introduction to Decision Analysis48 Questions
Exam 20: Introduction to Quality and Statistical Process Control42 Questions
Select questions type
Explain how Tchebysheff's theorem can be used to help describe data in a population or a sample.
(Essay)
4.7/5  (35)
(35)
The credit card balances for customers at State Bank and Trust has a mean equal to $800 and a standard deviation equal to $60.00. Kevin Smith's balance is $1,352. Based on this, his standardized value is 9.20.
(True/False)
4.9/5 (40)
If a distribution for a quantitative variable is thought to be nearly symmetric with very little variation, and a box and whisker plot is created for this distribution, which of the following is true?
(Multiple Choice)
4.8/5 (36)
A large retail company gives an employment screening test to all prospective employees. Franklin Gilman recently took the test and it was reported back to him that his score placed him at the 80th percentile. Therefore:
(Multiple Choice)
4.9/5 (32)
Incomes in a particular market area are known to be right-skewed with a mean equal to $33,100. In a report issued recently, a manager stated that at least 89 percent of all incomes are in the range of $26,700 to $39,500, and this was based on Tchebysheff's theorem. Given these facts, what is the standard deviation for the incomes in this market area?
(Multiple Choice)
4.7/5 (36)
In order to compute the mean and standard deviation, the level of data measurement should be:
(Multiple Choice)
4.7/5 (35)
First Pacific Bank has determined that the mean checking account balance for all its customers is currently $743.50. Based on this, it is fair to say that about half the customers have balances exceeding $743.50.
(True/False)
4.9/5 (33)
Based on the empirical rule we can assume that all bell-shaped distributions have approximately 95 percent of the values within ± 2 standard deviations of the mean.
(True/False)
4.9/5 (44)
At a sawmill in Oregon, a process improvement team measured the diameters for a sample of 1,500 logs. The following summary statistics were computed:  Given this information, for a box and whisker plot which of the following statements is appropriate?
(Multiple Choice)
4.7/5 (43)
For a given set of data, if the data are treated as a population, the calculated standard deviation will be less than it would be had the data been treated as a sample.
(True/False)
5.0/5 (34)
A small company has 7 employees. The numbers of years these employees have worked for this company are shown as follows:  Based upon this information, the mean number of years that employees have been with this company is:
(Multiple Choice)
4.9/5 (32)
A population measure, such as the population mean, is called a:
(Multiple Choice)
4.8/5 (30)
You are given the following data:  Assuming that the data reflect the population of interest, the mean of the population is 36.00.
(True/False)
4.8/5 (36)
The sample mean is an estimate of μ and may be either higher or lower than μ depending on the sample.
(True/False)
4.9/5 (46)
A lakeside neighborhood in Washington is home to a couple of successful baseball and football players in Seattle. If news articles usually report the median household income in that neighborhood rather than the mean income, this would be because income is a left-skewed distribution.
(True/False)
4.8/5 (36)
The following data reflect the number of customers who return merchandise for a refund on Monday. Note these data reflect the population of all 10 Mondays for which data are available. 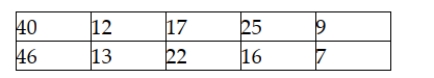 Assume that this same exact pattern of data were replicated for the next ten days. How would this affect the standard deviation for the new population with 20 items?
(Multiple Choice)
4.7/5 (34)
A store manager tracks the number of customer complaints each week. The following data reflect a random sample of ten weeks.  The standard deviation for these data is approximately 27.78.
(True/False)
4.9/5 (33)
Dynamic random-access memory (DRAM) memory chips are made from silicon wafers in manufacturing facilities through a very complex process called wafer fabs. The wafers are routed through the fab machines in an order that is referred to as a recipe. The wafers may go through the same machine several times as the chip is created. The data file DRAM Chips contains a sample of processing times, measured in fractions of hours, at a particular machine center for one chip recipe. Calculate the 80th percentile for processing time.
(Multiple Choice)
4.7/5 (34)
Filters
- Essay(0)
- Multiple Choice(0)
- Short Answer(0)
- True False(0)
- Matching(0)