Exam 3: Describing Data Using Numerical Measures
Exam 1: The Where, Why, and How of Data Collection167 Questions
Exam 2: Graphs, Charts and Tablesdescribing Your Data138 Questions
Exam 3: Describing Data Using Numerical Measures138 Questions
Exam 4: Introduction to Probability125 Questions
Exam 5: Discrete Probability Distributions161 Questions
Exam 6: Introduction to Continuous Probability Distributions122 Questions
Exam 7: Introduction to Sampling Distributions136 Questions
Exam 8: Estimating Single Population Parameters174 Questions
Exam 9: Introduction to Hypothesis Testing183 Questions
Exam 10: Estimation and Hypothesis Testing for Two Population Parameters121 Questions
Exam 11: Hypothesis Tests and Estimation for Population Variances69 Questions
Exam 12: Analysis of Variance162 Questions
Exam 13: Goodness-Of-Fit Tests and Contingency Analysis105 Questions
Exam 14: Introduction to Linear Regression and Correlation Analysis139 Questions
Exam 15: Multiple Regression Analysis and Model Building148 Questions
Exam 16: Analyzing and Forecasting Time-Series Data131 Questions
Exam 17: Introduction to Nonparametric Statistics103 Questions
Exam 18: Introducing Business Analytics48 Questions
Exam 19: Introduction to Decision Analysis48 Questions
Exam 20: Introduction to Quality and Statistical Process Control42 Questions
Select questions type
In a recent study of the sales prices of houses in a Midwestern city, the mean sales price has been reported to be $167,811 while the median sales price was $155,600. From this information, you can determine that the data involved in the study are left-skewed.
(True/False)
4.9/5  (34)
(34)
Dynamic random-access memory (DRAM) memory chips are made from silicon wafers in manufacturing facilities through a very complex process called wafer fabs. The wafers are routed through the fab machines in an order that is referred to as a recipe. The wafers may go through the same machine several times as the chip is created. The data file DRAM Chips contains a sample of processing times, measured in fractions of hours, at a particular machine center for one chip recipe. Compute the mean processing time.
(Multiple Choice)
4.8/5 (33)
When analyzing annual incomes of adults in a market area, the marketing manager's report indicated that the 90th percentile is $123,400. That means that 90 percent of the adult incomes in the market area fall at or below $123,400.
(True/False)
4.8/5 (37)
A recent study involving a sample of 3,000 vehicles in California showed the following statistics related to the number of miles driven per day: Q1 = 12, Q2 = 45, and Q3 = 56. Based on these data, we know that the distribution is skewed.
(True/False)
4.8/5 (33)
A recent study in the restaurant business determined that the mean tips for male waiters per hour of work are $6.78 with a standard deviation of $2.11. The mean tips per hour for female waiters are $7.86 with a standard deviation of $2.20. Based on this information, which of the following statements do we know to be true?
(Multiple Choice)
4.9/5 (35)
Acme Taxi has two taxi cabs. The manager tracks the daily revenue for each cab. Over the past 20 days, Cab A has averaged $76.00 per night with a standard deviation equal to $11.00. Cab B has averaged $200.00 per night with a standard deviation of $18.00. Based on this information, Cab B has the greatest relative variation.
(True/False)
4.7/5 (31)
In the annual report, a major food chain stated that the distribution of daily sales at its Detroit stores is known to be bell-shaped, and that 95 percent of all daily sales fell between $19,200 and $36,400. Based on this information, what were the mean sales?
(Multiple Choice)
4.7/5 (42)
A large retail company gives an employment screening test to all prospective employees. If a prospective employee receives a report saying that she scored at the 40th percentile:
(Multiple Choice)
4.8/5 (36)
For a symmetric distribution, if the median value is 150 and the second quartile is 40, the fourth quartile must also be 40.
(True/False)
4.8/5 (26)
Consider the following data, which represent the number of miles that employees commute from home to work each day. There are two samples: one for males and one for females. 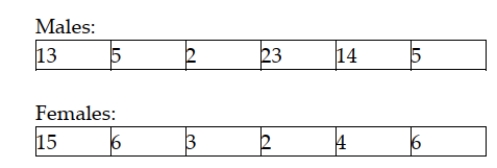 The coefficient of variation of commute miles for the males is:
(Multiple Choice)
4.9/5 (30)
A recent study involving a sample of 3,000 vehicles in California showed the following statistics related to the number of miles driven per day: Q1 = 12, Q2 = 45, and Q3 = 56. Based on these data, if a box and whisker plot is developed, the upper limit value is 122 miles.
(True/False)
4.9/5 (38)
A major automobile maker has two models of sedans. The first model has been shown to get an average of 27 mpg on the highway with a standard deviation equal to 5 mpg. The second model gets 33 mpg on average with a standard deviation of 8 mpg. Based on this information the first car model is relatively more variable than the second car model.
(True/False)
4.7/5 (35)
Suppose a study of houses that have sold recently in your community showed the following frequency distribution for the number of bedrooms: 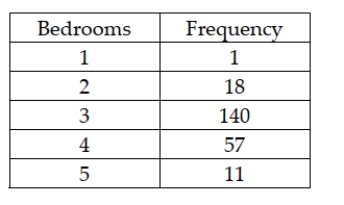 Based on this information, the median number of bedrooms in houses sold is 3.20.
(True/False)
4.7/5 (38)
The interquartile range is the difference between the mean and the median.
(True/False)
4.9/5 (30)
The distribution of the actual weight of potato chips in a 16 ounce sack is thought to be bell-shaped with a mean equal to 16 ounces and a standard deviation equal to 0.45 ounces. Based on this, between what two limits could we expect 95 percent of all sacks to weigh?
(Multiple Choice)
4.7/5 (35)
Under what circumstances is it necessary to use the coefficient of variation to compare relative variability between two or more distributions?
(Multiple Choice)
4.8/5 (31)
The following data reflect the number of customers who test drove new cars each day for a sample of 20 days at the Redfield Ford Dealership. 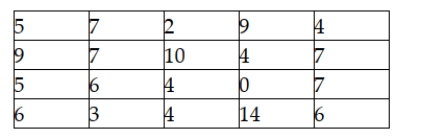 Given these data, what is the interquartile range?
(Multiple Choice)
5.0/5 (25)
At a sawmill in Oregon, a process improvement team measured the diameters for a sample of 1,500 logs. The following summary statistics were computed: 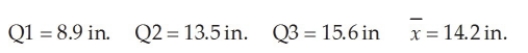 Given this information, which of the following statements is correct?
(Multiple Choice)
4.8/5 (40)
The AMI Company has two assembly lines in its Kansas City plant. Line A produces an average of 335 units per day with a standard deviation equal to 11 units. Line B produces an average of 145 units per day with a standard deviation equal to 8 units. Based on this information, which line is relatively more consistent?
(Essay)
4.9/5 (36)
You are given the following data: 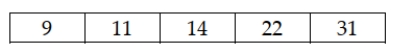 Assuming that these data reflect the population of interest, these data can be considered symmetric.
(True/False)
4.9/5 (32)
Filters
- Essay(0)
- Multiple Choice(0)
- Short Answer(0)
- True False(0)
- Matching(0)