Exam 11: The Analysis of Variance
Exam 1: Describing Data With Graphs94 Questions
Exam 2: Describing Data With Numerical Measures186 Questions
Exam 3: Describing Bivariate Data35 Questions
Exam 4: Probability and Probability Distributions136 Questions
Exam 5: Several Useful Discrete Distributions129 Questions
Exam 6: The Normal Probability Distribution196 Questions
Exam 7: Sampling Distributions162 Questions
Exam 8: Large-Sample Estimation173 Questions
Exam 9: Large-Sample Tests of Hypotheses210 Questions
Exam 10: Inference From Small Samples261 Questions
Exam 11: The Analysis of Variance156 Questions
Exam 12: Linear Regression and Correlation165 Questions
Exam 13: Multiple Regression Analysis178 Questions
Exam 14: Analysis of Categorical Data136 Questions
Exam 15: Nonparametric Statistics198 Questions
Select questions type
In a two-way ANOVA, there are 4 levels for factor A, 3 levels for factor B, and two observations within each of the 12 factor combinations. The number of treatments in this experiment will be 12.
(True/False)
4.8/5  (34)
(34)
Two samples of ten each from the male and female workers of a large company have been taken. The data involved the wage rate of each worker. To test whether there is any difference in the average wage rate between male and female workers, the most likely ANOVA design to fit this test situation is the randomized block design.
(True/False)
4.8/5 (39)
In one-way ANOVA, there is a single factor of interest but there may be multiple levels of the factor.
(True/False)
4.9/5 (42)
Two samples of ten each from the male and female workers of a large company have been taken. The data involved the wage rate of each worker. To test whether there is any difference in the average wage rate between male and female workers a pooled-variances t-test will be considered. Another test option to consider is ANOVA. The most likely ANOVA to fit this test situation is the randomized block design.
(True/False)
4.9/5 (43)
Due to his high blood pressure, Sam watches the sodium content of the foods that he eats. Five samples for each of four brands of canned turkey (97% fat free) were tested for sodium content, measured in milligrams of sodium per 2-ounce serving. 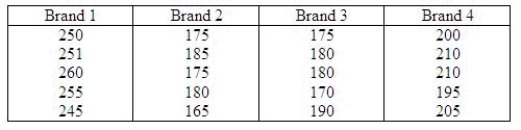 The following summary table and ANOVA were generated by statistical software as shown below:
 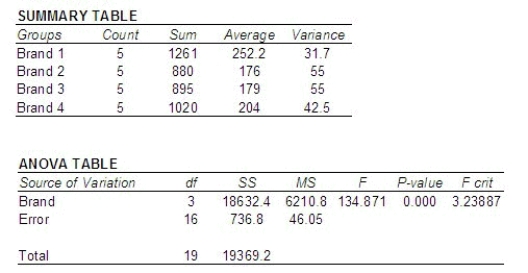 Use the p-value approach to test whether there is a significant difference in mean amount of sodium in the four brands. Let
  = 0.05.
Can you reject the null hypothesis?
______________
______________ of the brands of canned turkey has a significantly different mean sodium content from the others.
= 0.05.
Can you reject the null hypothesis?
______________
______________ of the brands of canned turkey has a significantly different mean sodium content from the others.
(Short Answer)
4.9/5 (38)
A consumer was interested in determining whether there is a significant difference in the price charged for tools by three hardware stores. The consumer selected five tools and recorded the price for each tool in each store. The following data was recorded: 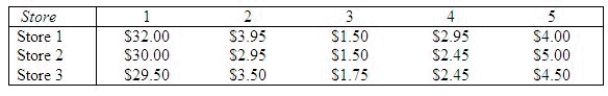 Fmodel = ______________
p-value = ______________
Ftool = ______________
p-value = ______________
Fstore = ______________
p-value = ______________
______________
Fmodel = ______________
p-value = ______________
Ftool = ______________
p-value = ______________
Fstore = ______________
p-value = ______________
______________
(Short Answer)
4.7/5 (32)
An independent random sampling design was used to compare the means of six treatments based on samples of four observations per treatment. The pooled estimator of  is 9.42, and the sample means follow:
 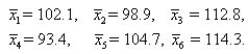 Give the value of
  that you would use to make pairwise comparisons of the treatment means for
  = 0.05. Rank the treatment means using pairwise comparisons.
Test statistics = ______________
Rank the treatment means using pairwise comparisons. Enter just the subscripts in order (1, 4, etc.).
_____ _____ _____ _____ _____ _____
= 0.05. Rank the treatment means using pairwise comparisons.
Test statistics = ______________
Rank the treatment means using pairwise comparisons. Enter just the subscripts in order (1, 4, etc.).
_____ _____ _____ _____ _____ _____
(Short Answer)
4.9/5 (38)
Suppose a reading comprehension test is given to random samples of three seventh graders from each of five different schools. The samples are chosen so that each school provides a student categorized as low IQ, average IQ, and high IQ. Perform an analysis using the data below treating the IQs as blocks. 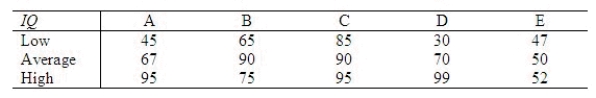 Is there sufficient evidence to reject the null hypothesis of no difference between the true mean test scores of the five schools? Draw conclusions using
  = 0.05.
What is the F-statistic?
______________
Reject Region: Reject H0 if |F| > ______________
Can you reject the null hypothesis? Use
= 0.05.
What is the F-statistic?
______________
Reject Region: Reject H0 if |F| > ______________
Can you reject the null hypothesis? Use  = 0.05.
______________
One ______________ conclude that there is a significant difference between the true mean test scores of the five schools.
= 0.05.
______________
One ______________ conclude that there is a significant difference between the true mean test scores of the five schools.
(Short Answer)
4.8/5 (42)
A building contractor employs three construction engineers, A, B, and C to estimate and bid on jobs. To determine whether one tends to be a more conservative (or liberal) estimator than the others, the contractor selects four projected construction jobs and has each estimator independently estimate the cost (in dollars per square foot) of each job. The data are shown in the table: 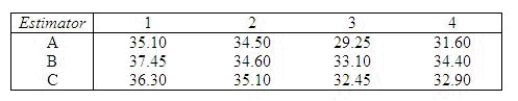 Analyze the experiment using the appropriate methods.
Means Plot
Analyze the experiment using the appropriate methods.
Means Plot  = ______________
There ______________ differences between that group of means.
= ______________
There ______________ differences between that group of means.
(Essay)
4.8/5 (37)
In a two-way factor ANOVA, the smallest number of replications required in any cell is 2, but all cells must have the same number of replications.
(True/False)
4.8/5 (37)
An insurance company is considering opening a new branch in Lansing. The company will choose the final location from two locations within the city. One of the factors in the decision is the annual family income (in thousands of dollars) of five families randomly sampled from a radius of five miles from the potential locations. 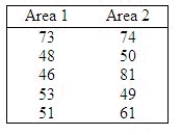 Perform equal-variances t-test at the 5% significance level to determine whether the population means differ.
What is the t-statistic?
______________
Reject Region: Reject H0 if |t| > ______________
Conclusion: ______________
The population means ______________ differ.
Perform an F-test for one-way ANOVA at the 5% level of significance to determine whether the population means differ.
What is the F-statistic?
______________
Reject Region: Reject H0 if |F| > ______________
Conclusion: ______________
The population means ______________ differ.
What is the relation between the observed t and observed F test statistics from the previous two questions?
F = ______________
Does the same relation hold true for the corresponding critical values?
______________
If we want to determine whether the population mean income for area 2 is higher than that for area 1, can we still use both the t and F -tests applied in the previous questions?
______________
Explain.
______________
Perform equal-variances t-test at the 5% significance level to determine whether the population means differ.
What is the t-statistic?
______________
Reject Region: Reject H0 if |t| > ______________
Conclusion: ______________
The population means ______________ differ.
Perform an F-test for one-way ANOVA at the 5% level of significance to determine whether the population means differ.
What is the F-statistic?
______________
Reject Region: Reject H0 if |F| > ______________
Conclusion: ______________
The population means ______________ differ.
What is the relation between the observed t and observed F test statistics from the previous two questions?
F = ______________
Does the same relation hold true for the corresponding critical values?
______________
If we want to determine whether the population mean income for area 2 is higher than that for area 1, can we still use both the t and F -tests applied in the previous questions?
______________
Explain.
______________
(Essay)
4.9/5 (35)
In a one-way ANOVA, if the null hypothesis that all population means are equal is rejected, then we can conclude that the alternative hypothesis is true and that all population means differ.
(True/False)
4.7/5 (34)
Which of the following statements about the ANOVA table is correct?
(Multiple Choice)
4.8/5 (43)
Consider the following partial ANOVA table:  The numerator and denominator degrees of freedom (identified by asterisks) are:
(Multiple Choice)
4.7/5 (40)
The degrees of freedom for a denominator in a one-way ANOVA test including 3 population means with 10 observations sampled from each population is equal to:
(Multiple Choice)
4.9/5 (41)
The equation: "Total SS = SSA + SSB + SS(AB) + SSE" applies to which ANOVA model?
(Multiple Choice)
4.8/5 (41)
In a completely randomized design for ANOVA, the number of degrees of freedom for the numerator and denominator are 3 and 16, respectively. The total number of observations must equal:
(Multiple Choice)
4.9/5 (42)
Tukey's method for making paired comparisons is based on the usual ANOVA assumptions.
(True/False)
4.9/5 (43)
In ANOVA for an a  b factorial experiment, it is necessary to have at least two measurements at each level of each factor in order to analyze any interaction between the factors.
(True/False)
4.8/5 (43)
Filters
- Essay(0)
- Multiple Choice(0)
- Short Answer(0)
- True False(0)
- Matching(0)