Exam 2: Describing Data With Numerical Measures
Exam 1: Describing Data With Graphs94 Questions
Exam 2: Describing Data With Numerical Measures186 Questions
Exam 3: Describing Bivariate Data35 Questions
Exam 4: Probability and Probability Distributions136 Questions
Exam 5: Several Useful Discrete Distributions129 Questions
Exam 6: The Normal Probability Distribution196 Questions
Exam 7: Sampling Distributions162 Questions
Exam 8: Large-Sample Estimation173 Questions
Exam 9: Large-Sample Tests of Hypotheses210 Questions
Exam 10: Inference From Small Samples261 Questions
Exam 11: The Analysis of Variance156 Questions
Exam 12: Linear Regression and Correlation165 Questions
Exam 13: Multiple Regression Analysis178 Questions
Exam 14: Analysis of Categorical Data136 Questions
Exam 15: Nonparametric Statistics198 Questions
Select questions type
Expressed in percentiles, the interquartile range is the difference between the:
(Multiple Choice)
4.9/5  (36)
(36)
For any distribution, the standard deviation is a measure of variability of the data around the median.
(True/False)
4.8/5 (32)
Attendance at London Symphony concerts for the past two years showed an average of 3,000 people per performance with a standard deviation of 100 people per performance. Attendance at a randomly selected concert was found to be 3,290. If attendance data is mound-shaped, does the attendance at the selected concert appear to be unusual?
__________
Justify your conclusion.
________________________________________________________
(Essay)
4.7/5 (43)
In a histogram, the proportion of the total area which must be to the left of the median is:
(Multiple Choice)
4.7/5 (33)
In a psychological experiment, the time on task was recorded for ten subjects under a 5-minute time constraint. These measurements are in seconds:
182 197 207 272 192 257 247 197 232 237
a. Find the average time on task.
______________
b. Find the median time on task.
______________
c. If you were writing a report to describe these data, which measure of central tendency would you use?
______________
Explain.
________________________________________________________
(Essay)
4.7/5 (33)
Which of the following statements is true for the following data values: 17, 15, 16, 14, 17, 18, and 22?
(Multiple Choice)
4.9/5 (36)
A sample of students who have taken a calculus test has a mean score of 78.2, a mode of 67, and a median score of 67. Based on this information, the distribution of test scores is:
(Multiple Choice)
4.8/5 (35)
A sample of 25 observations has a standard deviation of 4. The sum of the squared deviations from the sample mean is:
(Multiple Choice)
4.9/5 (37)
If the 18th and 19th observations in a set of 25 data values are 42.6 and 43.8, then the 70th percentile value is:
______________
(Short Answer)
4.7/5 (38)
Tchebysheff's Theorem states that: Given a number k greater than or equal to 1, and a set of measurements, at least (  ) of the measurements in the data set will lie within k standard deviations of their mean.
(True/False)
4.8/5 (27)
The following data represent the scores for a sample of 10 students on a 20-point chemistry quiz:
16 14 2 8 12 12 9 10 15 13
Calculate the z score for the smallest and largest observations.
Smallest: ______________
Largest: ______________
Is either of these observations unusually large or unusually small?
______________
(Short Answer)
4.8/5 (33)
The 10th percentile of a set of measurements is the value which exceeds 90% of the measurements and is less than the remaining 10% of the measurements.
(True/False)
4.9/5 (36)
One of the advantages of the standard deviation over the variance as a measure of variability is that the standard deviation is measured in the original units.
(True/False)
4.8/5 (38)
Since the population is always larger than the sample, the population mean:
(Multiple Choice)
4.9/5 (33)
Which of the following measures is not affected by extreme values in the data?
(Multiple Choice)
4.9/5 (31)
Measures of variability are numbers that indicate the spread or scatter of observations; they show the extent to which individual values in a data set differs from one another and, hence, differ from their central location.
(True/False)
4.7/5 (38)
Consider the data set: 5, 6, 7, 11, and 15. Its mean equals:
(Multiple Choice)
4.9/5 (31)
The sample variance calculated with a divisor of n gives a better estimate of the population variance,  , than does the sample variance,
  , with a divisor of n - 1.
(True/False)
4.9/5 (38)
The mean and variance of a sample of n = 25 measurements are 80 and 100, respectively. Explain in detail how to use Tchebysheff's Theorem to describe the distribution of measurements.
(Essay)
5.0/5 (35)
Given the following frequency table: 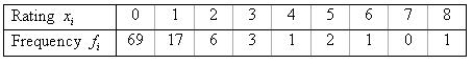 a. What fraction of the x values fall within two standard deviations of the mean?
______________
Within three standard deviations of the mean?
______________
b. Do the results of part (a) agree with Tchebysheff 's Theorem?
______________
c. Do the results of part (a) agree with the Empirical Rule?
______________
a. What fraction of the x values fall within two standard deviations of the mean?
______________
Within three standard deviations of the mean?
______________
b. Do the results of part (a) agree with Tchebysheff 's Theorem?
______________
c. Do the results of part (a) agree with the Empirical Rule?
______________
(Short Answer)
4.9/5 (41)
Filters
- Essay(0)
- Multiple Choice(0)
- Short Answer(0)
- True False(0)
- Matching(0)