Exam 2: Describing Data With Numerical Measures
Exam 1: Describing Data With Graphs94 Questions
Exam 2: Describing Data With Numerical Measures186 Questions
Exam 3: Describing Bivariate Data35 Questions
Exam 4: Probability and Probability Distributions136 Questions
Exam 5: Several Useful Discrete Distributions129 Questions
Exam 6: The Normal Probability Distribution196 Questions
Exam 7: Sampling Distributions162 Questions
Exam 8: Large-Sample Estimation173 Questions
Exam 9: Large-Sample Tests of Hypotheses210 Questions
Exam 10: Inference From Small Samples261 Questions
Exam 11: The Analysis of Variance156 Questions
Exam 12: Linear Regression and Correlation165 Questions
Exam 13: Multiple Regression Analysis178 Questions
Exam 14: Analysis of Categorical Data136 Questions
Exam 15: Nonparametric Statistics198 Questions
Select questions type
A sample of 600 values produced the following summary statistics:  Based on this information, upper fence on a box and whisker plot is:
(Multiple Choice)
4.7/5  (31)
(31)
The left and right ends of the box in a box and whisker plot represent the 25th and 75th percentiles, respectively.
(True/False)
4.9/5 (30)
If a store manager selected a sample of customers and computed the mean income for this sample, he has computed:
(Multiple Choice)
4.9/5 (34)
Twenty-eight applicants interested in working for the Food Stamp program took an examination designed to measure their aptitude for social work. A stem-and-leaf plot of the 28 scores appears below, where the first column is the count per branch, the second column is the stem value, and the remaining digits are the leaves. 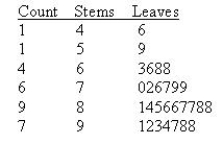 a. What is the median score?
______________
b. What is the sample mean for this data set?
______________
c. What is the value of the sample standard deviation?
______________
d. What is the range of this data?
______________
a. What is the median score?
______________
b. What is the sample mean for this data set?
______________
c. What is the value of the sample standard deviation?
______________
d. What is the range of this data?
______________
(Short Answer)
4.8/5 (35)
If the sample mean is much larger than the sample median, the data set is said to be skewed to the right.
(True/False)
4.8/5 (41)
Consider the following set of measurements: 6, 3, 5, 14, 2, 6, 0, and 8.
a. Find the 25th percentile:
______________,
Find the 50th percentile:
______________,
Find the 75th percentile:
______________.
b. What is the value of the interquartile range?
______________
(Short Answer)
4.8/5 (35)
The mean of forty sales receipts is $69.75 and the standard deviation is $10.25. Using Tchebysheff's Theorem, at least 75% of the sales receipts were between $49.25 and $90.25.
(True/False)
4.8/5 (35)
For larger sample sizes, a rough approximation for the sample standard deviation s is that s R / 4, where R is the range.
(True/False)
4.8/5 (40)
The standard deviation is the positive square root of the variance.
(True/False)
4.7/5 (37)
The distribution of checking account balances for customers at Independent Bank is known to be bell - shaped with a mean of $1,800 and a standard deviation of $300. Given this information, the percentage of accounts with balances between $1,500 and $2,100 will be approximately 95%.
(True/False)
4.8/5 (30)
In a histogram, the proportion of the total area which must be to the left of the median is more than 0.50 if the distribution is skewed to the right.
(True/False)
4.9/5 (38)
The mean is one of the most frequently used measures of variability.
(True/False)
4.7/5 (40)
The distribution of a set of data is considered to be symmetric if the first quartile and the 25th percentile are equal.
(True/False)
4.8/5 (36)
Which of the following summary measures is affected most by outliers?
(Multiple Choice)
4.7/5 (43)
The value (n + 1) / 2 indicates the value of the median in an ordered data set, where n is the number of data values.
(True/False)
4.8/5 (44)
Tchebysheff's Theorem provides us with a measure of shape that focuses on the difference between the mode and the mean and then relates it to the standard deviation.
(True/False)
4.8/5 (32)
For any distribution, if the mean is equal to the standard deviation, you can infer that the distribution is symmetric.
(True/False)
4.8/5 (36)
Suppose the hourly dollar amount of food sold by a Burger King franchise follows an approximately mound-shaped distribution with a mean sales level of $400 per hour and a standard deviation of $60 per hour.
a. What percentage of the working hours does this Burger King franchise sell between $280 and $520 worth of food per hour?
______________
b. Suppose yesterday, during a one-hour period, this Burger King franchise had sales at the 84th percentile. What dollar sales figure does this represent?
______________
(Short Answer)
4.8/5 (38)
Numerical descriptive measures computed from population measurements are called parameters.
(True/False)
4.9/5 (47)
Filters
- Essay(0)
- Multiple Choice(0)
- Short Answer(0)
- True False(0)
- Matching(0)