Exam 2: Describing Data With Numerical Measures
Exam 1: Describing Data With Graphs94 Questions
Exam 2: Describing Data With Numerical Measures186 Questions
Exam 3: Describing Bivariate Data35 Questions
Exam 4: Probability and Probability Distributions136 Questions
Exam 5: Several Useful Discrete Distributions129 Questions
Exam 6: The Normal Probability Distribution196 Questions
Exam 7: Sampling Distributions162 Questions
Exam 8: Large-Sample Estimation173 Questions
Exam 9: Large-Sample Tests of Hypotheses210 Questions
Exam 10: Inference From Small Samples261 Questions
Exam 11: The Analysis of Variance156 Questions
Exam 12: Linear Regression and Correlation165 Questions
Exam 13: Multiple Regression Analysis178 Questions
Exam 14: Analysis of Categorical Data136 Questions
Exam 15: Nonparametric Statistics198 Questions
Select questions type
You are given the data values 5, 10, 15, 20, and 25. If these data were considered to be a population, and you calculated the mean, you would get the same answer as if these data were considered to be a sample from another larger population.
(True/False)
4.8/5  (32)
(32)
The mode of a data set or a distribution of measurements, if it exists, is unique.
(True/False)
4.8/5 (40)
From a sample of size 100, the following descriptive measures were calculated: median = 23, mean = 20, standard deviation = 5, range = 35; seventy-five sample values are between 10 and 30; and ninety-nine sample values are between 5 and 35. If you knew the sample mean, median, and standard deviation were correct, which one of the following conclusions might you draw?
(Multiple Choice)
4.7/5 (42)
Any unusually large observation (as measured by a z-score greater than 3), or any unusually small observation (as measured by a z-score smaller than -3) is considered an outlier.
(True/False)
4.9/5 (35)
Tchebysheff's Theorem states that the percentage of measurements in a data set that fall within three standard deviations of their mean is:
(Multiple Choice)
4.8/5 (36)
Incomes of workers in an automobile company in Michigan are known to be right - skewed with a mean equal to $36,100. If at least 8/9 of all incomes are in the range of $29,600 to $42,800, and this was based on Tchebysheff's Theorem, what is the standard deviation for the auto workers?
(Multiple Choice)
5.0/5 (25)
Twenty-eight applicants interested in working for the Food Stamp program took an examination designed to measure their aptitude for social work. A stem-and-leaf plot of the 28 scores appears below, where the first column is the count per branch, the second column is the stem value, and the remaining digits are the leaves. 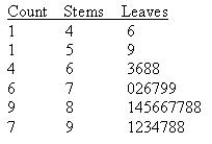 What is the value of the first quartile?
Q1 = ______________
What is the value of the third quartile?
Q3 = ______________
What is the interquartile range?
IQR = ______________
Find the inner fences.
______________
Find the outer fences.
______________
Construct a boxplot for this data.
Does the boxplot indicate the presence of any outliers?
______________
What is the value of the first quartile?
Q1 = ______________
What is the value of the third quartile?
Q3 = ______________
What is the interquartile range?
IQR = ______________
Find the inner fences.
______________
Find the outer fences.
______________
Construct a boxplot for this data.
Does the boxplot indicate the presence of any outliers?
______________
(Essay)
4.9/5 (39)
Which of the following statements is true for the following data values: 17, 15, 16, 14, 17, 18, and 22?
(Multiple Choice)
4.9/5 (30)
Given a distribution of measurements that is approximately mound-shaped, the Empirical Rule states that the approximate percentage of measurements in a data set that fall within two standard deviations of their mean is approximately:
(Multiple Choice)
4.9/5 (34)
Twenty-eight applicants interested in working for the Food Stamp program took an examination designed to measure their aptitude for social work. A stem-and-leaf plot of the 28 scores appears below, where the first column is the count per "branch," the second column is the stem value, and the remaining digits are the leaves. 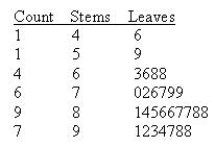 a. Should the Empirical Rule be applied to this data set?
______________
b. Use the range approximation to determine an approximate value for the standard deviation.
______________
Is this a good approximation?
______________
a. Should the Empirical Rule be applied to this data set?
______________
b. Use the range approximation to determine an approximate value for the standard deviation.
______________
Is this a good approximation?
______________
(Short Answer)
4.9/5 (30)
Consider the following set of measurements:
5.4, 5.9, 3.5, 4.1, 4.6, 2.5, 4.7, 6.0,
5.4, 4.6, 4.9, 4.6, 4.1, 3.4, 2.2
You may use the Data Analysis tool if you want.
a. Find the 25th percentile:
______________,
Find the 50th percentile:
______________,
Find the 75th percentile:
______________.
b. What is the value of the interquartile range?
______________
(Short Answer)
4.9/5 (36)
A distribution is said to be skewed to the right if the population mean is larger than the sample mean.
(True/False)
4.7/5 (32)
The value of the mean times the number of observations equals the sum of all of the observations.
(True/False)
4.8/5 (36)
The standard deviation is expressed in terms of the original units of measurement but the variance is not.
(True/False)
4.9/5 (35)
The interquartile range is the difference between the lower and upper quartiles.
(True/False)
4.8/5 (34)
The following five-number summary for a sample of size 500 were obtained: Minimum = 250,  and Maximum = 4,950. Based on this information, if you were to construct a box and whisker plot, the value corresponding to the right - hand edge of the box would be 4,800.
(True/False)
4.7/5 (37)
The distribution of credit card balances for customers is highly skewed to the right with a mean of $1,200 and a standard deviation of $150. Based on this information, approximately 68% of the customers will have credit card balances between $1,050 and $1,350.
(True/False)
4.9/5 (32)
A data sample has a mean of 87, and a median of 117. The distribution of the data is positively skewed.
(True/False)
4.8/5 (39)
Filters
- Essay(0)
- Multiple Choice(0)
- Short Answer(0)
- True False(0)
- Matching(0)