Exam 2: Describing Data With Numerical Measures
Exam 1: Describing Data With Graphs94 Questions
Exam 2: Describing Data With Numerical Measures186 Questions
Exam 3: Describing Bivariate Data35 Questions
Exam 4: Probability and Probability Distributions136 Questions
Exam 5: Several Useful Discrete Distributions129 Questions
Exam 6: The Normal Probability Distribution196 Questions
Exam 7: Sampling Distributions162 Questions
Exam 8: Large-Sample Estimation173 Questions
Exam 9: Large-Sample Tests of Hypotheses210 Questions
Exam 10: Inference From Small Samples261 Questions
Exam 11: The Analysis of Variance156 Questions
Exam 12: Linear Regression and Correlation165 Questions
Exam 13: Multiple Regression Analysis178 Questions
Exam 14: Analysis of Categorical Data136 Questions
Exam 15: Nonparametric Statistics198 Questions
Select questions type
Thirty-three students were asked to rate themselves on whether they were outgoing or not using this five point scale: 1 = extremely extroverted, 2 = extroverted, 3 = neither extroverted nor introverted, 4 = introverted, or 5 = extremely introverted. The results are shown in the table below: 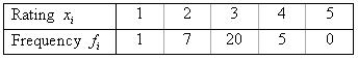 a. Find the percentage of measurements in the following intervals:
 = ______________
 = ______________
This interval contains approximately ______________% of the data.
= ______________
This interval contains approximately ______________% of the data.
 = ______________
 = ______________
This interval contains approximately ______________% of the data.
b. Comment on the shape of the distribution.
____________________________
= ______________
This interval contains approximately ______________% of the data.
b. Comment on the shape of the distribution.
____________________________
(Short Answer)
4.9/5  (38)
(38)
An analytical chemist wanted to use electrolysis to determine the number of moles of cupric ions in a given volume of solution. The solution was partitioned into n = 30 portions of 0.2 milliliter each. Each of the n = 30 portions was tested. The average number of moles of cupric ions for the n = 30 portions was found to be 0.185 mole; the standard deviation was 0.015 mole. Calculate the following intervals:  = ______________
  = ______________
  = ______________
Describe the distribution of the measurements for the n = 30 portions of the solution using Tchebysheff's Theorem.
________________________________________________________
Describe the distribution of the measurements for the n = 30 portions of the solution using the Empirical Rule.
________________________________________________________
Suppose the chemist had used only n = 5 portions of the solution for the experiment and obtained the readings 0.18, 0.21, 0.20, 0.22, and 0.18. Would the Empirical Rule be suitable for describing the n = 5 measurements?
______________
Explain.
________________________________________________________
= ______________
Describe the distribution of the measurements for the n = 30 portions of the solution using Tchebysheff's Theorem.
________________________________________________________
Describe the distribution of the measurements for the n = 30 portions of the solution using the Empirical Rule.
________________________________________________________
Suppose the chemist had used only n = 5 portions of the solution for the experiment and obtained the readings 0.18, 0.21, 0.20, 0.22, and 0.18. Would the Empirical Rule be suitable for describing the n = 5 measurements?
______________
Explain.
________________________________________________________
(Essay)
4.7/5 (34)
The value of the standard deviation may be either positive or negative, while the value of the variance will always be positive or zero.
(True/False)
4.8/5 (31)
The Empirical Rule and Tchebysheff's Theorem can be used to describe data sets.
(True/False)
4.9/5 (25)
Measures of center are values around which observations tend to cluster and that describe the location of what in some sense might be called the "center" of a data set.
(True/False)
4.9/5 (34)
Filters
- Essay(0)
- Multiple Choice(0)
- Short Answer(0)
- True False(0)
- Matching(0)