Exam 3: Functions and Graphs
Exam 1: Algebra and Equations409 Questions
Exam 2: Graphs, Lines, and Inequalities255 Questions
Exam 3: Functions and Graphs323 Questions
Exam 4: Exponential and Logarithmic Functions192 Questions
Exam 5: Mathematics of Finance183 Questions
Exam 6: Systems of Linear Equations and Matrices215 Questions
Exam 7: Linear Programming203 Questions
Exam 8: Sets and Probability240 Questions
Exam 9: Counting, Probability Distributions, and Further Topics in Probability210 Questions
Exam 10: Introduction to Statistics169 Questions
Exam 11: Differential Calculus342 Questions
Exam 12: Applications of the Derivative220 Questions
Exam 13: Integral Calculus227 Questions
Exam 14: Multivariate Calculus152 Questions
Select questions type
Find the appropriate linear cost or revenue function.
-Fixed cost, ;
5 items cost to produce. Find the linear cost function.
(Multiple Choice)
5.0/5  (33)
(33)
Find the appropriate linear cost or revenue function.
-Marginal cost, ;
50 items cost to produce. Find the linear cost function.
(Multiple Choice)
4.8/5 (30)
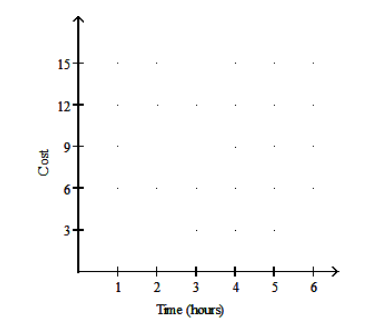
Graph the function.
-A store has its own parking garage. Customers can park free of charge for up to one hour. For customers who stay more than one hour, the store charges for each additional hour or fraction of an hour. So for example, a customer who parks for three and a half hours is charged \$9. Graph the function.
(Multiple Choice)
4.8/5 (33)
Find the rule of a quadratic function whose graph has the given vertex and passes through the given point.
-vertex point
(Multiple Choice)
4.8/5 (31)
Find the appropriate linear cost or revenue function.
-A cab company charges a base rate of plus 10 cents per minute. Let be the cost in dollars of using the cab for minutes. Find the linear cost function.
(Multiple Choice)
4.8/5 (35)
Give the equation of the vertical asymptote(s) of the rational function.
-
(Multiple Choice)
4.9/5 (43)
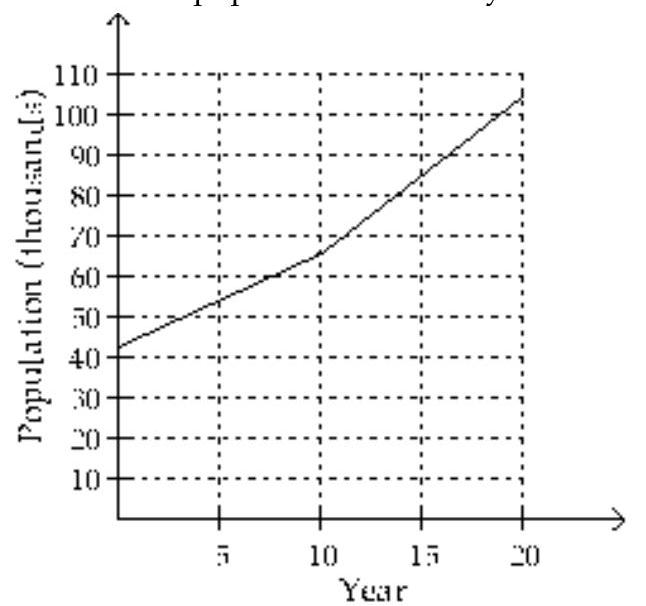
Use the graph to solve the problem.
-The population (in thousands) of one city is approximated by
The graph of this function is shown below. In this graph, represents 1970. Use the graph to estimate the population of the city in 1979.
(Multiple Choice)
4.9/5 (28)
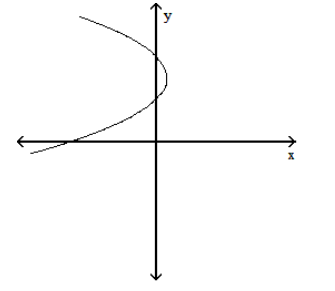
Use the vertical line test to determine if the graph is a graph of a function.
-
(True/False)
4.9/5 (40)
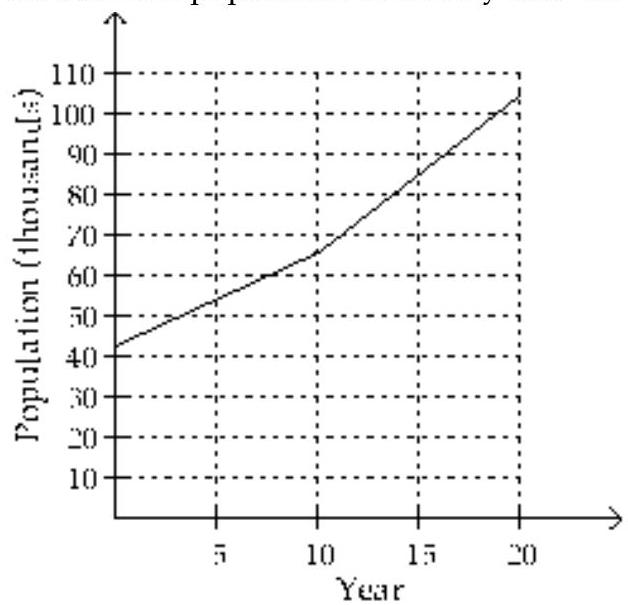
Use the graph to solve the problem.
-The population (in thousands) of one city is approximated by
The graph of this function is shown below. In this graph, represents 1970. Use the graph to estimate the population of the city in 1986.
(Multiple Choice)
4.8/5 (40)
Find the rule of a quadratic function whose graph has the given vertex and passes through the given point.
-vertex ; point
(Multiple Choice)
4.8/5 (44)
Solve the problem.
-In the following formula, is the minimum number of hours of studying required to attain a test score of . How many hours of study are needed to score
(Multiple Choice)
4.9/5 (32)
Filters
- Essay(0)
- Multiple Choice(0)
- Short Answer(0)
- True False(0)
- Matching(0)